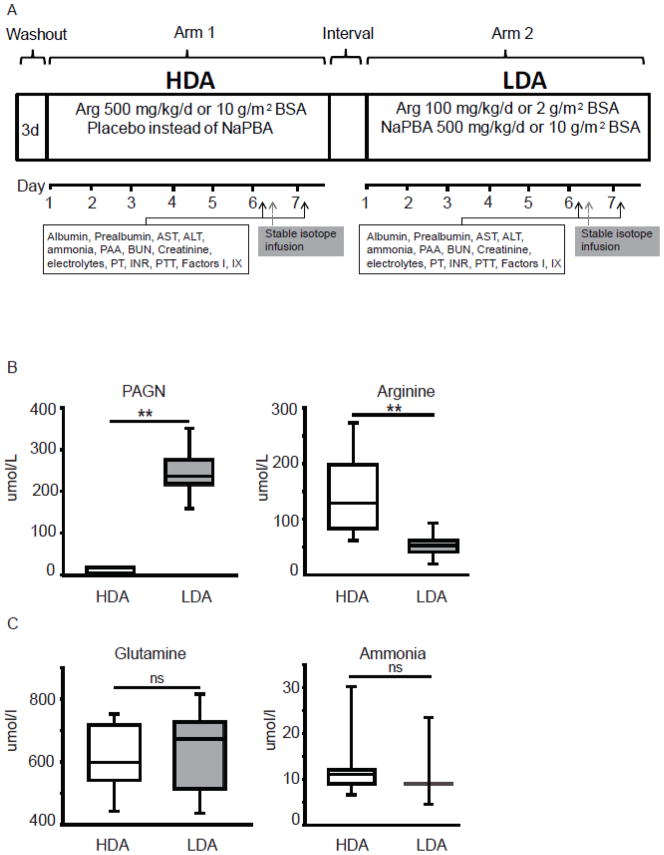
Figure 1. Study design.
A. Illustrative example of the depicting the study design and study procedures. In this depiction, the subject was randomized to high-dose arginine as the first treatment arm. (PAA – plasma amino acids, BUN – blood urea nitrogen, PT-prothrombin time, PTT- partial thromboplastin time, INR-International normalized ratio) B. Plasma PAGN levels are elevated in patients while on the LDA arm due to conjugation of phenylbutyrate with glutamine to form PAGN. Treatment with high-dose of arginine leads to increase in plasma arginine levels (** P<0.001). C. Short-term nitrogen balance was comparable in both treatment arms as evidenced by normal plasma ammonia and glutamine levels (ns - not significant). The box plots depict the 25th and 75th centile along with the median whereas the error bars depict the 5th and 95th centile.

