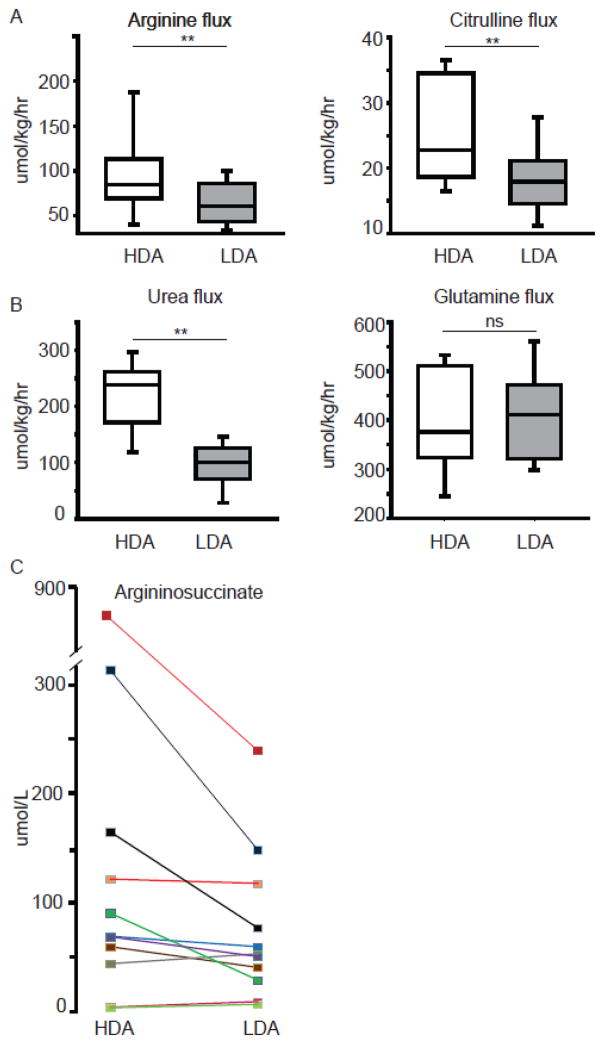
Figure 2. Effect of the two treatment arms on metabolite fluxes and argininosuccinate levels.
The arginine, citrulline (A) and the urea (B, left panel) fluxes are increased with the high-dose arginine treatment while glutamine flux (B, right panel) is comparable in both arms (**P<0.001, ns - not significant). C. Treatment with the high-dose of arginine results in increased plasma argininosuccinate (P<0.05). Each data-point on depicts the mean of two values measured on days 6 and 7.

