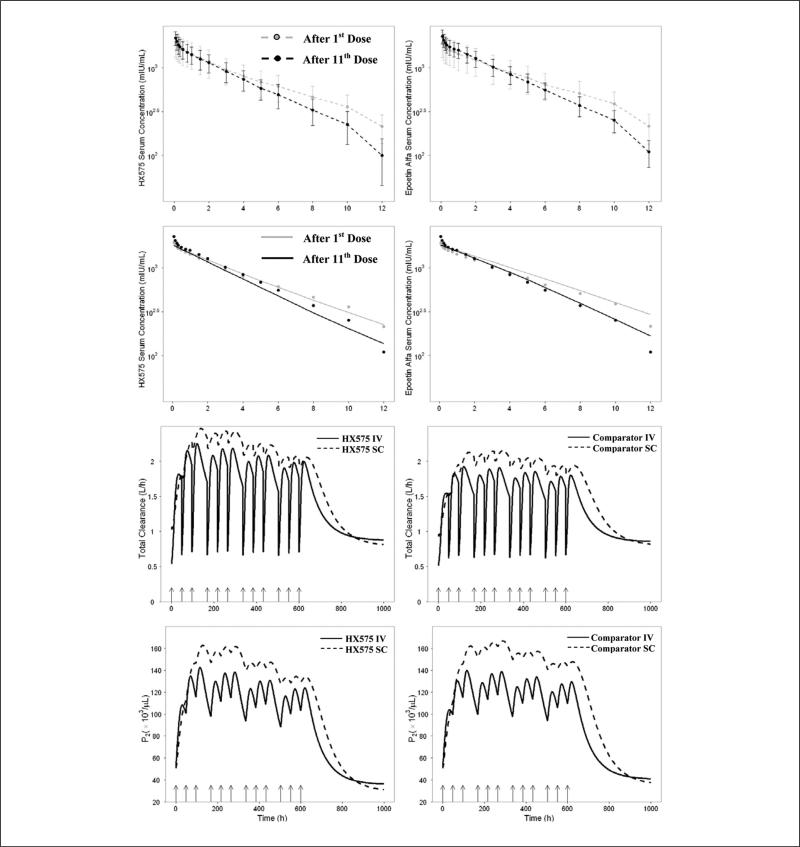
Figure 2.
First 2 panels: mean observed concentrations vs time since last dose profiles after the 1st IV dose and 11th IV dose with standard deviation bars for HX575 (left) and the comparator epoetin alfa (right). One-tailed paired t test was applied to compare the mean observed AUC0-12 after the 1st and 11th IV doses. P = .0059 for HX575 and P = .13 for the comparator. Second 2 panels: mean concentrations vs time since the last dose profiles after the 1st IV dose and 11th IV dose generated from the visual predictive check for HX575 (left) and the comparator epoetin alfa (right). Black and gray circles represent the observed mean data. Third 2 panels: simulation of the total clearance vs time profiles after multiple IV and SC administrations of HX575 (left) and the comparator (right). Fourth 2 panels: simulation of P2 vs time profiles after multiple IV and SC administrations of HX575 (left) and the comparator (right). Arrows represent dosing events.

