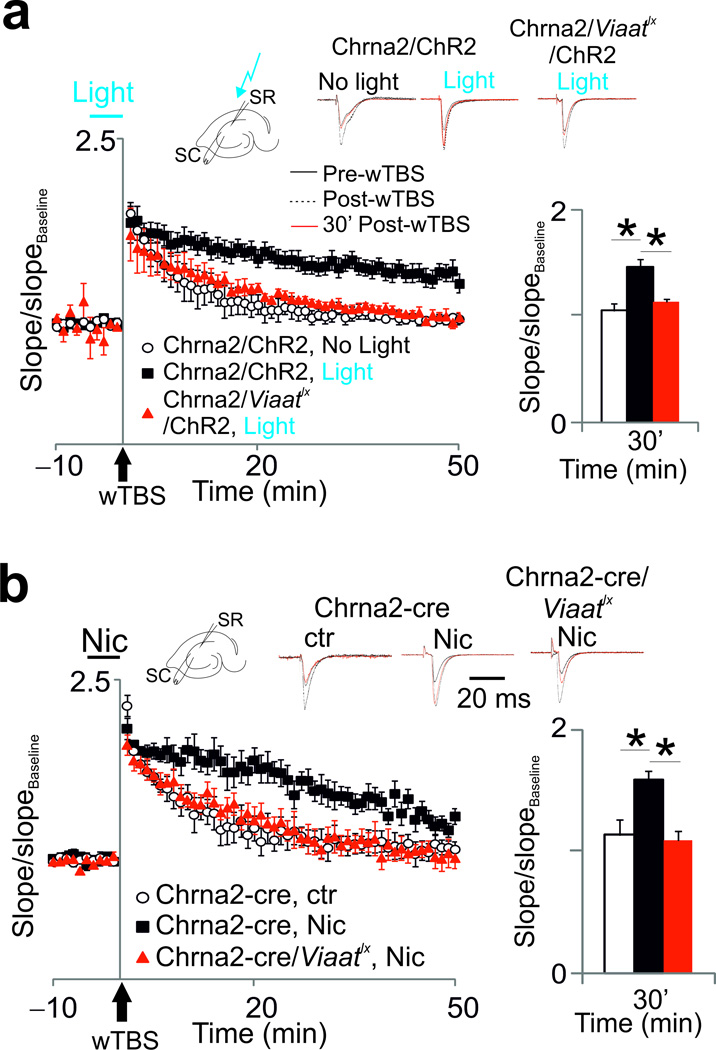
Figure 4. OLMα2 cells enhance LTP in the SC pathway.
(a) Potentiation of SC synapses in Chrna2-cre/ChR2 and Chrna2-cre/Viaatlx/ChR2 mice in control conditions (no light) and with a light pulse applied 5 min prior to and during SC wTBS. Top traces show normalized fEPSPs before (black line), 10 min (dashed black line) and 30 min (red line) after wTBS. Bar graphs show the mean normalized slope 30 min after wTBS. Error bars denote ± s.e.m. (b) Same as in a, but with 1µM bath-applied nicotine instead of light stimulation. Schematics show overview of stimulation setups.

