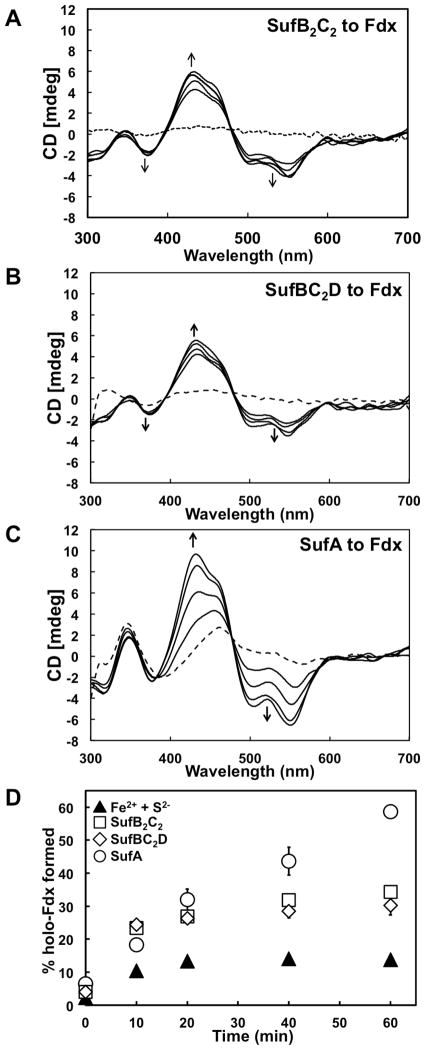
Fig. 3. Fe-S cluster transfer from holo-SufB2C2, holo-SufBC2D, or holo-SufA to apo-Fdx.
A, CD spectra of a mixtures containing 300 μM (A) holo-SufB2C2, (B) holo-SufBC2D, or (C) holo-SufA and 200 μM of apo-Fdx recorded at 10, 20, 40 and 60 min time intervals. The dashed lines show the CD spectrum of holo-Suf proteins at 0 min time point. D, Comparison of holo-Fdx formed over time during transfer from holo-SufB2C2 (squares), holo-SufBC2D (diamonds), or holo-SufA (circles) to de novo reconstitution on Fdx with an equivalent amount of Na2S and FAS in the absence of Suf proteins (filled triangles). Error bars for multiple experiments are shown (but may be obscured by some sybmols).

