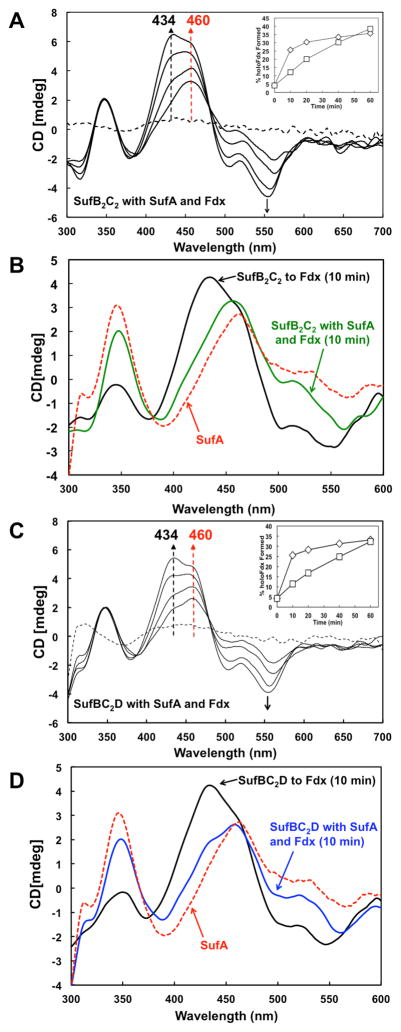
Fig. 4. Fe-S cluster transfer from holo-SufB2C2 or holo-SufBC2D to apo-Fdx in the presence of apo-SufA.
A, CD spectra of 300 μM of holo-SufB2C2 with 200 μM each of apo-Fdx and apo-SufA were recorded over time. Inset, Comparison of holo-Fdx formed during transfer from holo-SufB2C2 alone (diamonds) or from holo-SufB2C2 with apo-SufA (squares). B, 10 min time point CD spectra of cluster transfer to apo-Fdx from holo-SufB2C2 alone (black line) or from holo-SufB2C2 with apo-SufA (green line). 300 μM Holo-SufA alone (red dashed line) is shown for comparison. C, CD spectra of 300 μM of holo-SufBC2D with 200 μM each of apo-Fdx and apo-SufA were recorded over time. Inset, Comparison of holo-Fdx formed during transfer from holo-SufBC2D alone (diamonds) or from holo-SufBC2D with apo-SufA (squares). D, 10 min time point CD spectra of cluster transfer to apo-Fdx from holo-SufBC2D alone (black line) or from holo-SufBC2D with apo-SufA (blue line). 300 μM holo-SufA alone (red dashed line) is shown for comparison.

