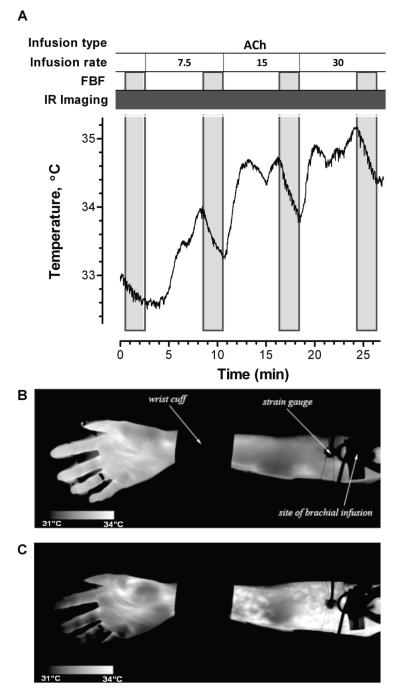
Figure 2. Temperature profile and infrared images in one subject during ACh infusion.
A, ACh was infused at escalating rates of 7.5, 15, and 30 μg/min. FBF was measured at baseline and before each ACh infusion rate increase. Infrared (IR) images were acquired continuously. The region of interest used to calculate forearm skin temperature was between the wrist cuff and the strain gauge. B, An IR image of the subject’s forearm during saline infusion. C, An IR image during ACh infusion. Increased skin temperature was immediately apparent in the real-time IR images during ACh infusion.

