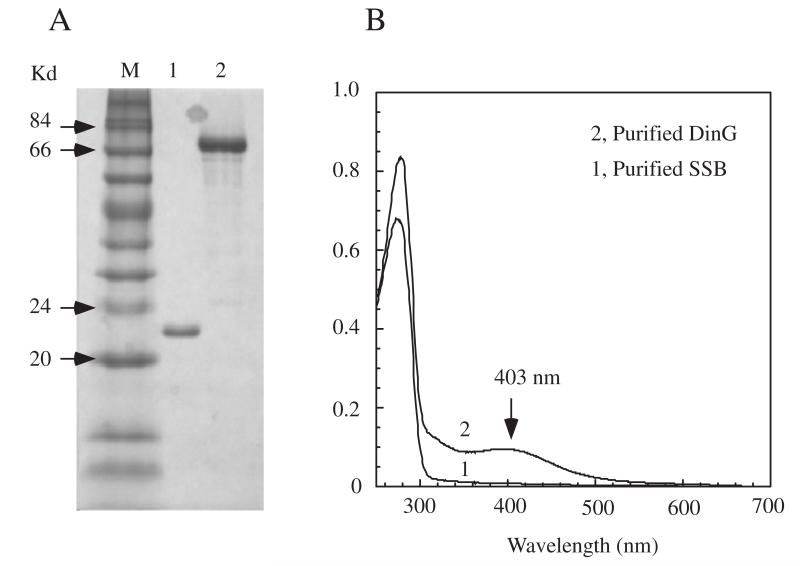
Figure 1. Purification of E. coli DinG and SSB.
A), SDS-PAGE gel of purified E. coli DinG and SSB. Lane M, molecular weight markers; lane 1, purified SSB; lane 2, purified DinG. B), UV-vis absorption spectrum of purified E. coli SSB (spectrum 1) and DinG (spectrum 2). The proteins were dissolved in buffer containing NaCl (500 mM) and Tris (20 mM, pH 8.0). The contraction of SSB and DinG shown in B0 was 22 and 10 μM, respectively.

