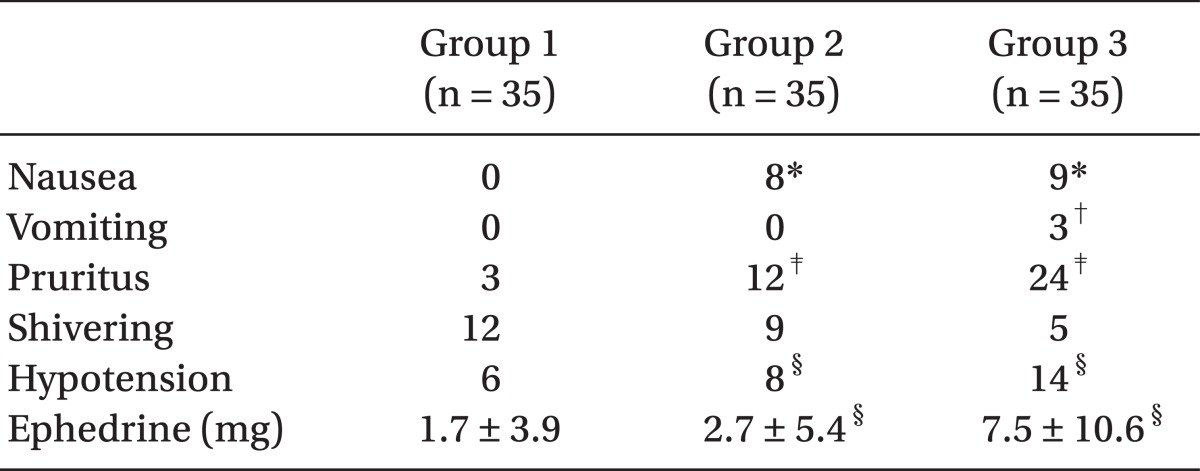
Table 6.
The Number of Patients with Side Effects
Values are number of patients or means ± SDs. Group 1: control, Group 2: sufentanil 2.5 µg, Group 3: sufentanil 5 µg. *P < 0.05 Group 2, 3 vs Group 1 (Fisher's exact test), †P < 0.05 Group 3 vs Group 1,2 (Fisher's exact test), ‡P < 0.05 Group 2, 3 vs Group 1 (Fisher's exact test), §P < 0.05 Group 2, 3 vs Group 1 (Linear by linear association).

