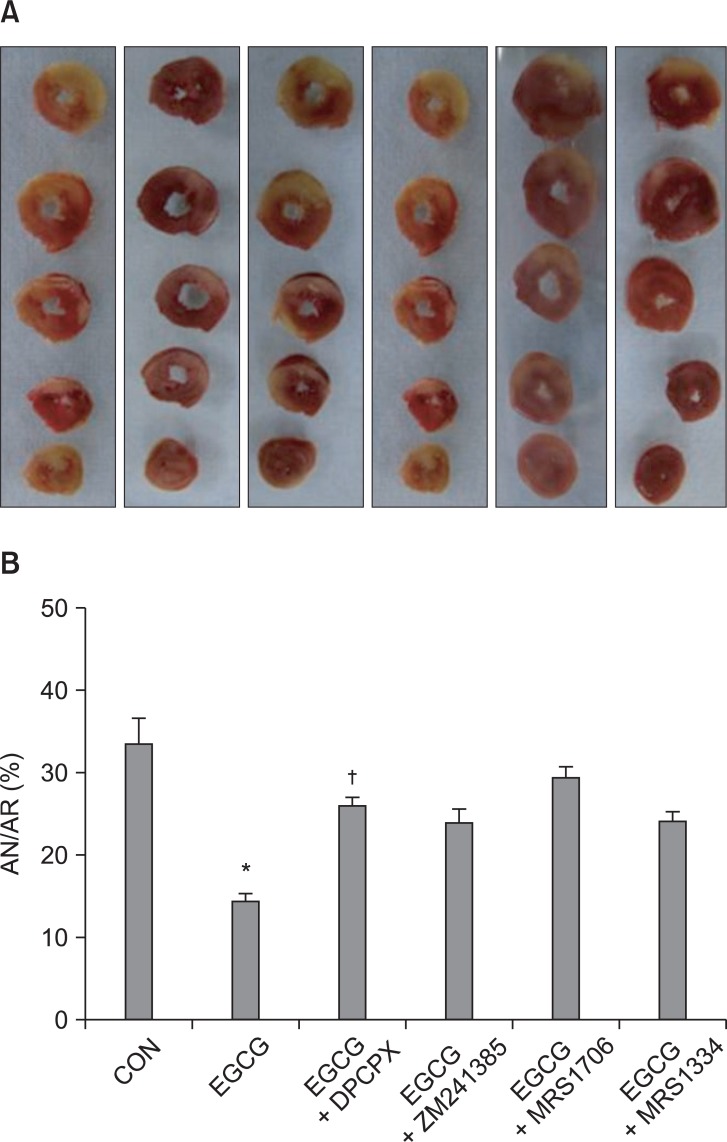
Fig. 4.
(A) Representative sequential left ventricle (LV) slices from each group showing area of necrosis (pale area) with TTC staining after adenosine receptor (ADR) antagonist pretreatment in EGCG treat hearts. (B) % of infarct area (AN) over area at risk (AR). All data are expressed as means ± SEM. CON: untreated control hearts, EGCG: polyphenol (-)-epigallocatechin gallate, DPCPX: A1 ADR antagonist, ZM241385: A2a ADR antagonist, MRS1706: A2b ADR antagonist, MRS1334: A3 ADR antagonist. *P < 0.05 vs. CON, †P < 0.05 vs. EGCG.

