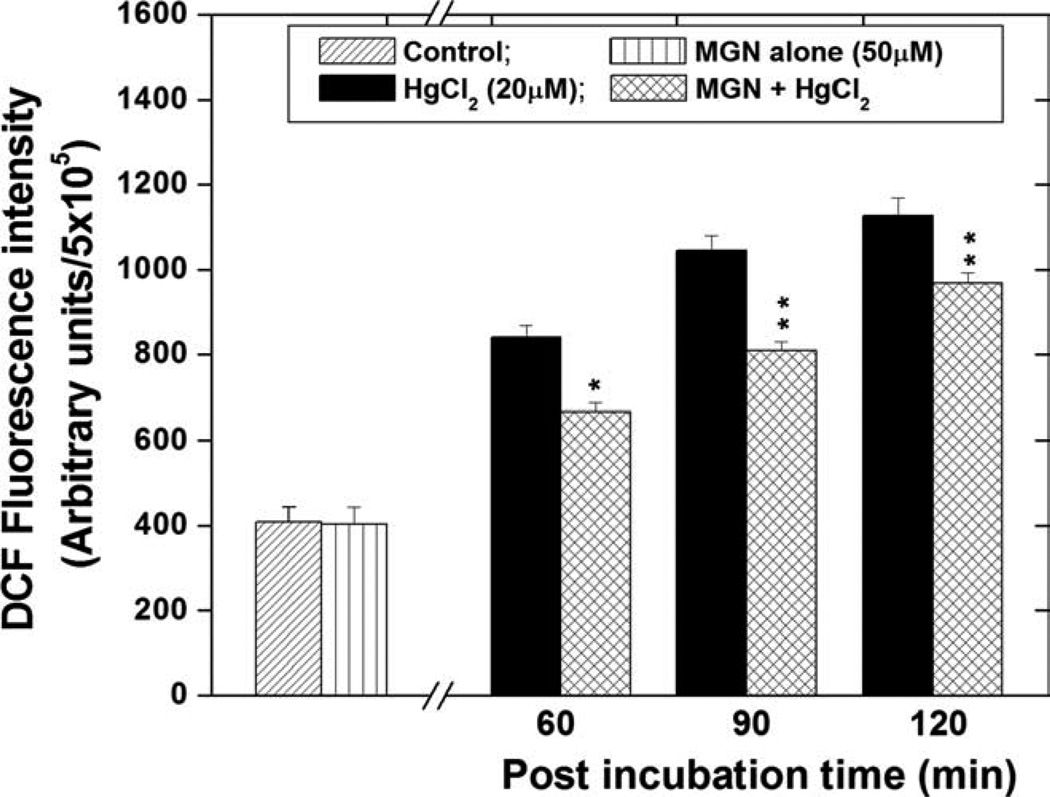
Fig. 2.
Effect of mangiferin on ROS generation in HepG2 cells treated with 20 µM of HgCl2 and post incubation for different time periods. The significant levels *P < 0.05, **P < 0.01, and No symbol = Nonsignificant, when compared with respective HgCl2 alone group. Each experiment was performed at least three times and the data are expressed as mean ± SEM.

