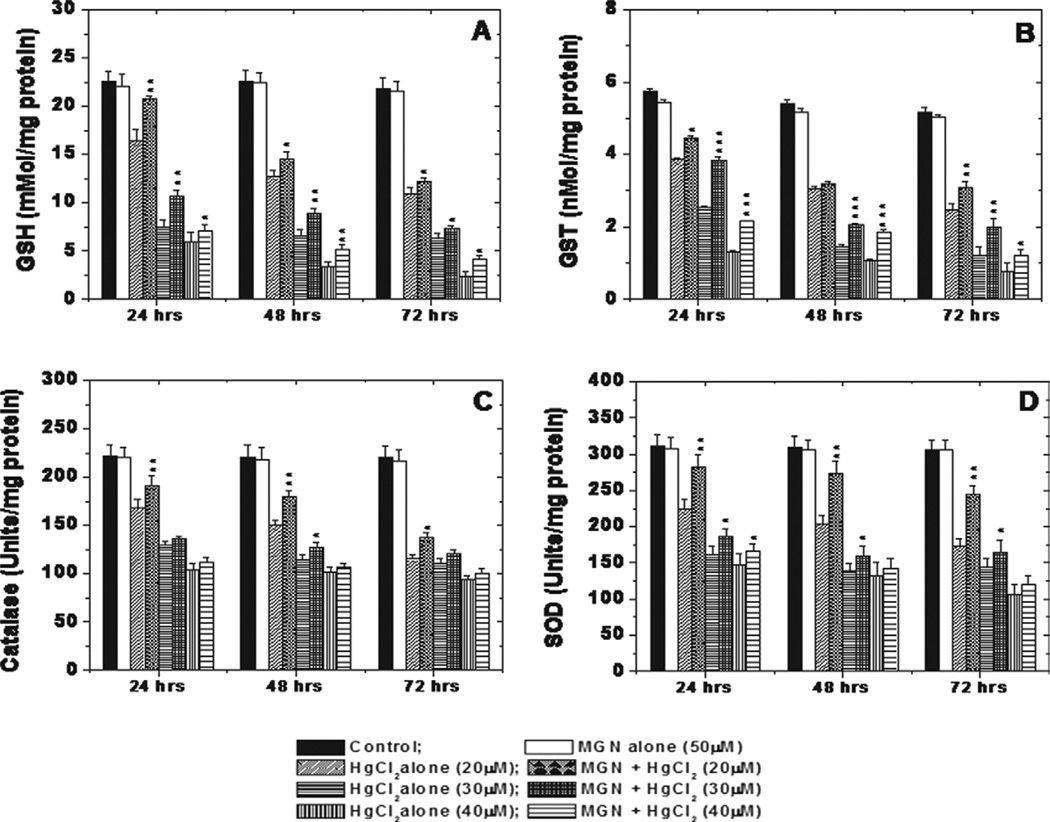
Fig. 6.
Graphs showing toxic effect of HgCl2 and protective effect of MGN on GSH (A), GST (B), SOD (C) and CAT (D) activities in HepG2 cells after 24, 48 and 72 h of post incubation. The significant levels *P < 0.05; **P < 0.01; ***P < 0.001 and No symbol = Non significant, when compared with respective HgCl2 alone group. Each experiment was performed at least three times and the data are expressed as average enzyme units per mg of protein.

