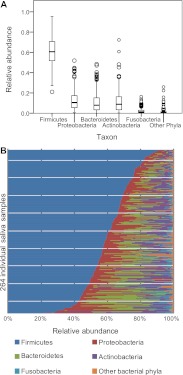
Figure 1.
(A) Box-and-whiskers plot of the five major bacterial phyla of 264 human saliva samples. The top of the box represents the 75th percentile, the bottom of the box points to the 25th percentile, and the black line in the middle shows the median. The whiskers represent the highest and lowest values up to 1.5 times the interquartile range; extreme values and outliers are represented by empty circles. (B) Relative abundance of the five major bacterial phyla of all individual saliva samples, sorted by decreasing Firmicutes content.

