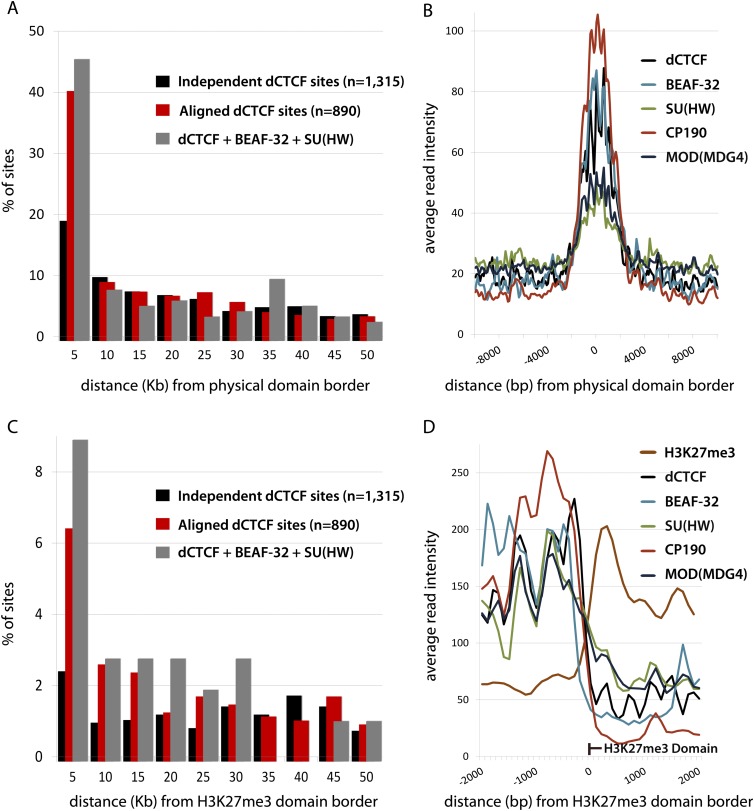
Figure 4.
Aligned dCTCF sites are enriched at the borders of H3K27me3 and physical domains. (A) Percentage of independent and aligned dCTCF sites within 5 kb from recently mapped physical domain boundaries (Sexton et al. 2012). (B) Average read intensity for insulator proteins at physical domain boundaries, ±10 kb. Comparison of insulator profiles normalized by total read numbers. (C) Percentage of independent and aligned dCTCF sites within 5 kb from H3K27me3 domain borders. (D) Average read intensity for H3K27me3 and insulator proteins at H3K27me3 domain borders, ±2 kb. Comparison of insulator profiles normalized by total read numbers.

