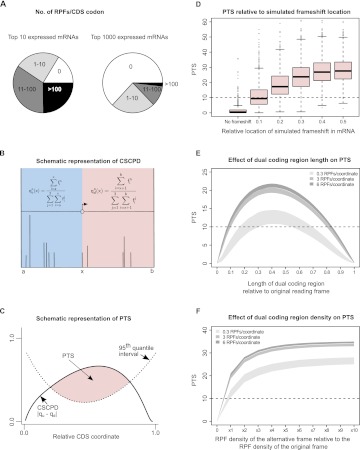
Figure 2.
Computational approach for detecting transitions between reading frames and their performance on simulated dual coding. (A) Segments of pie charts represent the number of CDS codons with the specific number of RPFs aligning to them for the top 10 (left) and for the top 1000 (right) most covered mRNAs from the Guo et al. (2010) data set. It can be seen that, even for the most RPF-covered mRNAs, many CDS codons have no RPFs aligning to them. (B) Calculation of cumulative RPF subcodon proportion differences (CSCPD) upstream of and downstream from a sliding point x. Position a represents the annotated CDS start, while position b denotes the annotated CDS stop. Vertical lines represent RPFs that align at given CDS coordinates. (C) Principle of the automated scoring scheme, Periodicity Transition Score (PTS). PTS is calculated as the area (shaded in pink) where CSCPD over the examined CDS exceeds the expected level as estimated from the 95th quantile CSCPDs of the 1000 mRNA transcripts with the highest RPF coverage. For details, see Results. (D) Boxplots representing the distributions of PTS scores (y-axis) obtained for real ribosome profiles for mRNAs with artificially introduced frameshifts at different locations relative to the ends of CDS (x-axis). (E) Distribution of PTS for ribosome profiles on simulated mRNAs containing simultaneously translated dual coding regions of different lengths. The simulations were carried out for three sets of mRNAs with different RPF density as indicated in the figure. The shaded areas represent the lower and upper quartile intervals for each RPF density. (F) Distribution of PTS for simulated mRNAs containing dual coding regions with varying densities of RPFs in the alternative frame. Shading is as in E.

