
Figure 3.

Bipolar disorder interaction. In a genome-wide scan of all 400 billion variable pairs (four genetic models tested per SNP pair) in the WTCCC bipolar disorder data set (Affymetrix 500K), SIXPAC found one significant interaction 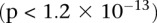 between SNPs >5 cM apart that satisfied all our filtering criteria. The SNPs rs10925490 and rs2041140 lie within the RYR2 gene on chr1q43 and the CACNA2D4 gene on chr12p13.33, respectively. Each figure shows the −log(P-value) from a standard single-locus association test (allelic model) of the two SNPs as well as 25 SNPs immediately upstream and downstream from each of them, along the x-axis and y-axis. Also shown in the grayscale area is the −log(p) from the pairwise LD-contrast test of all
  variable pairs. As suggested by the original finding, SNPs around rs10925490 were considered in dominant allelic mode, while SNPs around rs2041140 were in recessive mode. We replicated this signal by similarly testing
  dominant–recessive pairs of variables around the very same SNPs in a much smaller bipolar disorder data set from the GAIN Consortium (Affymetrix 6.0). In the replication data set, we observe several pairs that cross the significance threshold and a strikingly similar visual pattern in the LD-contrast landscape (see main text for a permutation analysis). The top pair (rs677730–rs11062012) in this area is pinpointed with dashed lines (see main text for permutation analysis). Standard single-locus association analysis does not yield any significant result in either data set, as seen in the marginal Manhattan plots (the gray dashed line represents the genome-wide significance level).