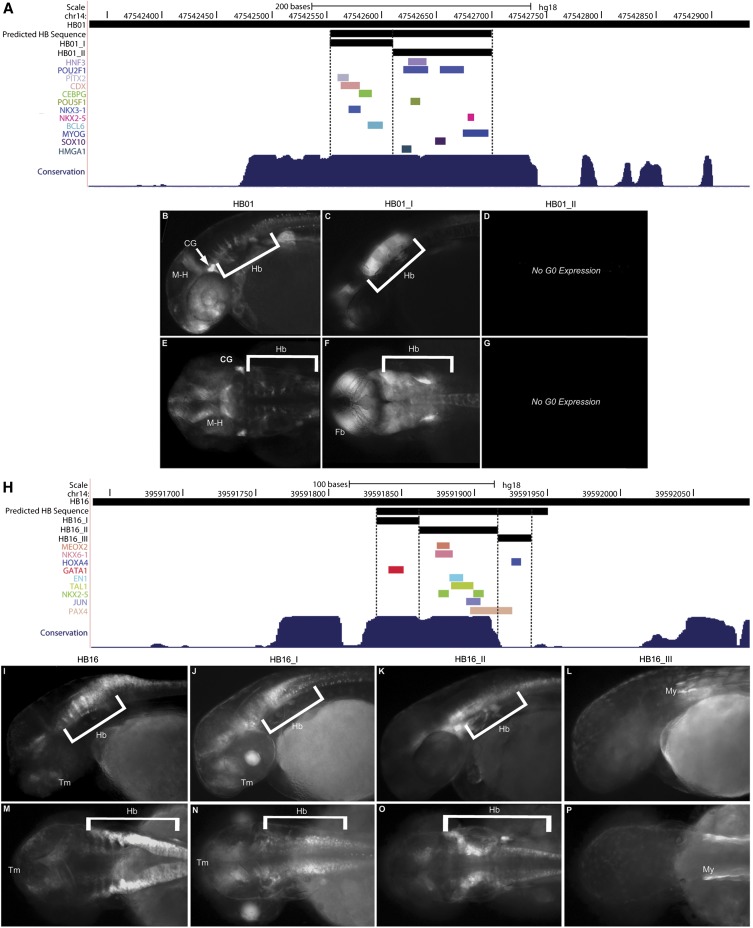
Figure 4.
TF clustering reveals functional sequence domains. (A,H) UCSC Genome Browser custom track showing injected construct, classifier predicted HB sequence, and fragments tested for Hb expression (black bars, top to bottom). Colored bars mark TFBS for various factors. (B–G, I–P) GFP reporter expression observed with each sequence (lateral view, top; dorsal view, bottom). All images taken at 2 dpf, anterior to the left. (A) HB01 custom track with two subcloned fragments, (B) full-length HB01, lateral view, (C) HB01_I, lateral view, (D) HB01_II, no G0 GFP reporter expression observed, (E) full-length HB01, dorsal view, (F) HB01_I, dorsal view, (G) HB01_II, no G0 GFP reporter expression observed. (H) HB16 custom track with three subcloned fragments, (I) full-length HB16, lateral view, (J) HB16_I, lateral view, (K) HB16_II, lateral view, (L) HB16_III, lateral view, (M) full-length HB16, dorsal view, (N) HB16_I, dorsal view, (O) HB16_II, dorsal view, (P) HB16_III, dorsal view. (CG) cranial ganglia; (M-H) midbrain hindbrain boundary; (Hb) hindbrain; (Fb) forebrain; (Tm) tegmentum; (My) myotome; (L) lens.

