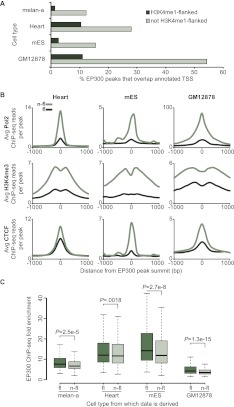
Figure 3.
EP300 peaks that overlap H3K4me1-flanked regions have distinct properties. (A) Percent of EP300 peaks that directly overlap an annotated TSS (UCSC Genes; [dark green] peaks that overlap H3K4me1-flanked regions; [light green] peaks that do not overlap H3K4me1-flanked regions). Data for Heart (C57bl/6 mouse tissue taken at 8 wk), mES (Mouse ES-Bruce 4), and GM12878 generated by ENCODE and modENCODE consortia. (B) Average number ChIP-seq reads per peak for Pol2 (top row), H3K4me3 (middle row), and CTCF (bottom row) in a 2-kb window around the summits of indicated EP300 peaks (H3K4me1-flanked indicated by fl and dark green; non-H3K4me1-flanked, n-fl and light green). Three columns show data from the heart, mES, and GM12878, respectively. (C) EP300 ChIP-seq fold enrichment (determined by MACS) of EP300 peaks that overlap H3K4me1-flanked regions (fl; darker green), and EP300 peaks that do not overlap H3K4me1-flanked regions (n-fl; lighter green). Corresponding P-values calculated by two-tailed t-test. Numbers of peaks are as follows: melan-a fl, 2489; n-fl, 1133; heart fl, 3324; heart n-fl, 23,236; mES fl, 1258; mES n-fl, 20,062; GM12878 fl, 3404; and GM12878 n-fl, 6703.

