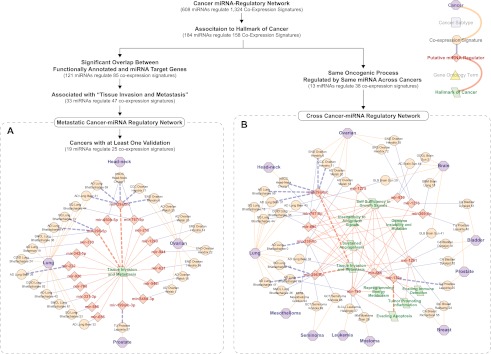
Figure 4.
Metastatic and cross-cancer–miRNA regulatory networks. Hierarchy of filters applied to the cancer–miRNA regulatory network to produce both the metastatic and cross-cancer miRNA-regulatory networks is depicted above the networks, and a legend for the networks can be found in the top right corner. Nodes are cancers (purple octagons), coexpression signatures (orange circles), inferred miRNAs (red diamonds), or hallmarks of cancer (green parallelogram). Orange edges describe the cancer where a coexpression signature was observed, blue edges link a putative miRNA regulator to a coexpression signature (putative miRNA regulation from cancer miRNA regulatory network), and red edges link putative miRNAs to the hallmarks of cancer based upon functional enrichment of the coexpression signatures they regulate (GO term semantic similarity). (Thicker dashed edges) Experimental validation for the inferred relationship. (A) Metastatic cancer–miRNA regulatory network was filtered for the sake of space to show only cancers with at least one predicted regulatory interaction that has been validated. (B) The cross-cancer–miRNA regulatory network was generated by identifying miRNAs with more than one coexpression signature that are functionally enriched for the same GO terms, and that are sufficiently similar to GO terms characterizing the hallmarks of cancer.

