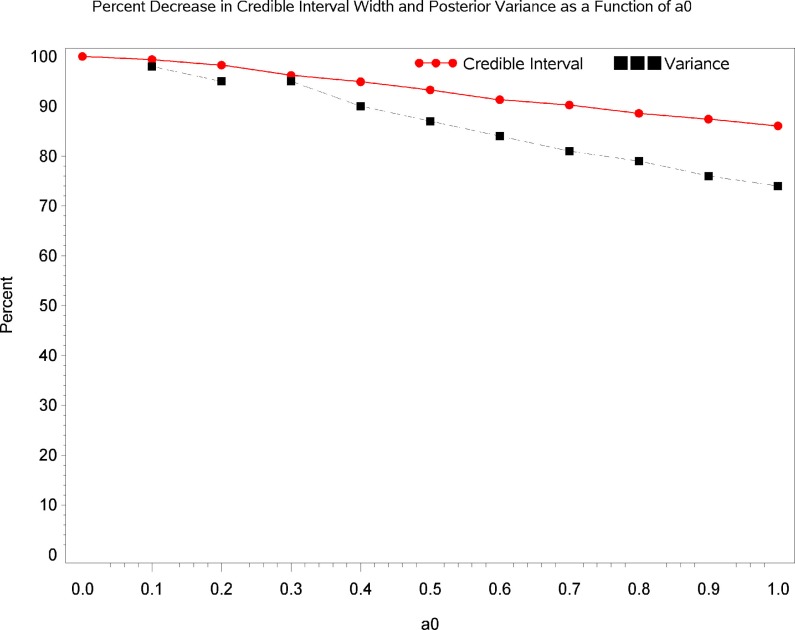
Figure 3.
Change in the precision of the parameter estimate as a function of a0. The red line shows the magnitude of the decrease in the Credible Interval range as a percentage of its width at a0 = 0, as a function of altering a0. The blue line shows the magnitude of the decrease in the variance of the posterior distribution as a function of altering a0.

