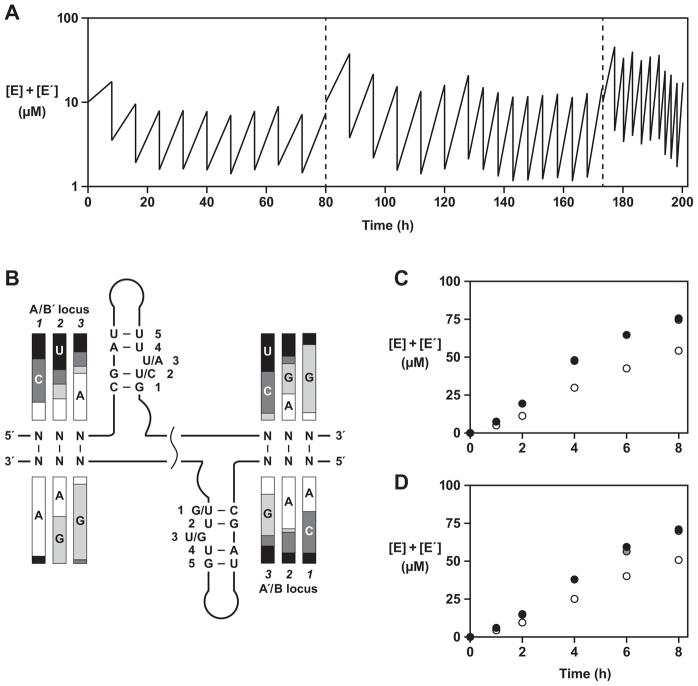
Figure 4.
Self-sustained evolution of RNA enzymes. (A) Serial transfer procedure involving 35 successive rounds of growth and dilution. After the 10th round (left dashed line), an enriched set of substrates was prepared from the population of enzyme molecules and used in subsequent rounds. After the 25th round (right dashed line), the same enriched set of A and A′ substrates was used, together with B59 and B′213. (B) Sequence variation among 47 clones isolated after the 25th round (see also Table S3). The relative proportions of the four nucleotides at each genotype position are indicated by shaded bars. The most abundant nucleotides at each phenotype position are shown. (C, D) Cross-replication reactions employing: 5 μM each of the population of E and E′ molecules obtained after the 25th round; 50 μM each of the enriched set of A and A′ molecules obtained after the 25th round; either (C) 50 μM B′213 or (D) 50 μM B′245; and either 50 μM B27 (white circles), 50 μM B51 (grey circles), or 50 μM B59 (black circles). (See also Figure S2)

