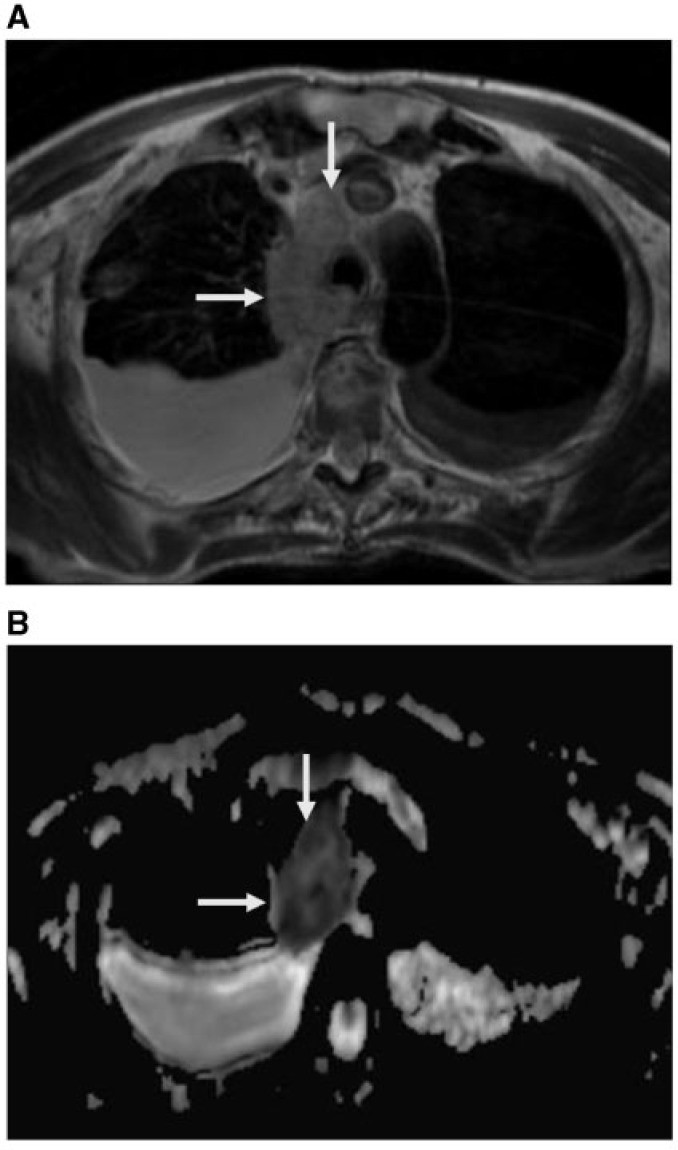
Figure 4.
Mediastinal lymphoma. (A) Axial true FISP shows enlarged right-sided mediastinal lymph node (arrows) with bilateral pleural effusion. (B) ADC map shows restricted diffusion with low ADC values (1.23 × 10⁻³ mm2/s) of the mediastinal node (arrows). The pleural effusion shows high ADC values (3.22 × 10⁻³ mm2/s on the right side and 2.98 × 10⁻³ mm2/s on the left side.

