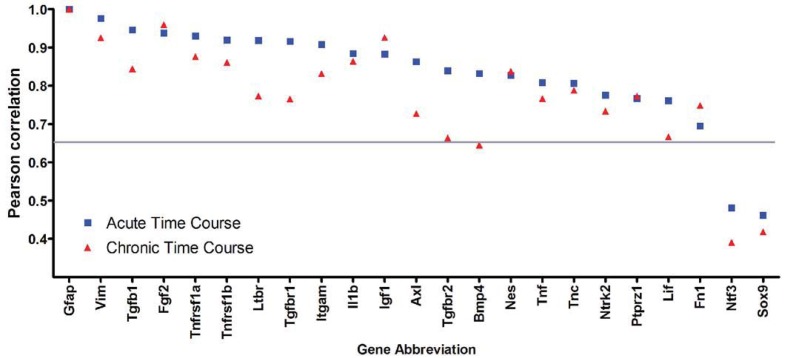
Figure 10. Comparison of acute and chronic time courses based on the Pearson correlation with GFAP.
Genes that clustered with GFAP are ordered as in the heat map for the acute time course (Figure 7A). Correlations above 0.65 are considered significant (grey line) (Krasnov et al., 2005). Genes associated with characterization of astrocyte reactivity have a similar correlation across the acute and chronic time courses, as shown for Vim, Nes, TnC, Ptprz1 and Fn1. A similar tight correlation with GFAP for both time courses is found for FGF2 and IGF-1. However, many of the signalling components in the lesion environment show lower correlations with GFAP during the chronic time course, as shown for the TGFβ1, TGFβR1 and TGFβR2, BMP4 and LIF.

