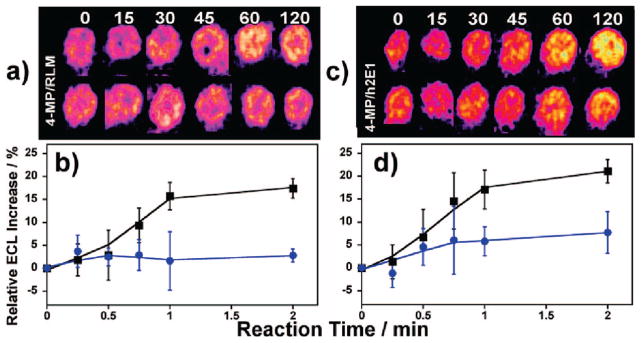
Figure 3.
Inhibition by 4-MP. (a) Reconstructed data showing ECL response from RLM spots on same array exposed to 1 mM NPYR without (top) and with (bottom) 50 μM 4-MP as selective cyt P450 2E1 inhibitor for denoted times (s). (b) % ECL change for RLM spots not exposed (black squares) and exposed (blue circles) to 4-MP. (c) Similar reconstructed data as (a) using h2E1 spots. (d) % ECL change for h2E1 spots not exposed (black squares) and exposed (blue circles) to 4-MP.

