Figure 4.
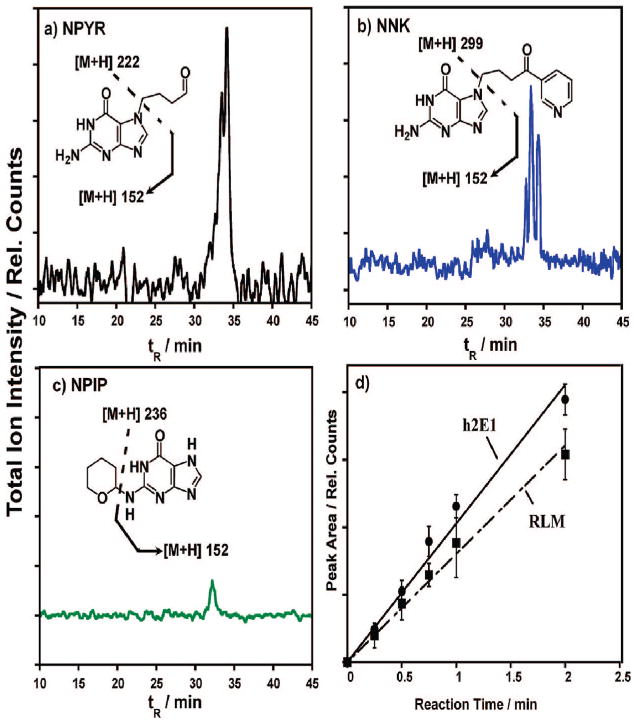
SRM-MS chromatograms measuring total ion current for predominant guanine adduct (m/z shown in inset) produced via exposure of (a) NPYR, (b) NNK, and (c) NPIP to RLM/DNA films on silica nanospheres followed by DNA hydrolysis. Insets show examples of relevant guanine adducts and fragmentation patterns consistent with each chromatogram. (d) Integrated UV diode array measured peak area increase for NPYR–guanine adducts with reaction time from both RLM and h2E1 films.

