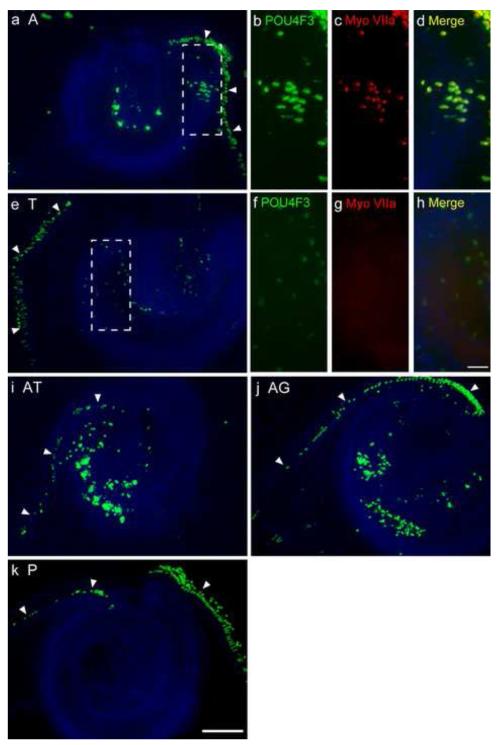
Fig. 6. Co-transfection enhances Pou4f3/GFP induction in the GER by ATOH1.
The apical turn of P1.5 explants, 5 days after transfection with transcription factors (TFs). Transfection with 0.5 μg/μl of hATOH1 alone (a) or hTCF3 alone (e) induced Pou4f3/GFP+ cells in the GER, well inside the native HCs (arrow heads) of Pou4f3/GFP mouse sensory epithelium. Transfection of hATOH1 in combination with either hTCF3 (i) or hGATA3 (j) induced more Pou4f3/GFP+ GER cells than hATOH1 alone. Transfection of an empty vector (k) did not induce Pou4f3/GFP+ GER cells. The figure also illustrates the loss of HCs (arrowheads) induced by electroporation. It should be noted that the explants were imaged daily and the position of all HCs were traced, and that no migration of HCs into the GER was ever observed (see Fig. 7) Panels b-d and f-h show a higher magnification of the sample transfected with hATOH1 alone (a) and hTCF3 alone (e) respectively. hATOH1 alone induced myosin VIIa (Myo VIIa) expression, but hTCF3 did not. The scale bar in e = 200 μm. The scale bar in h = 50 μm. A, 0.5 μg/μl of hATOH1 expression plasmid; T, 0.5 μg/μl of hTCF3 expression plasmid; G, 0.5 μg/μl of hGATA3 expression plasmid; P, 0.5 μg/μl of empty plasmid.

