Figure 1.

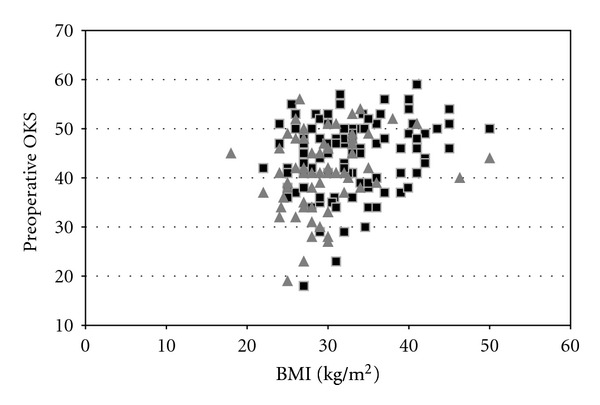
Scatter plot showing a relationship between BMI and preoperative OKS. Black squares indicate female patients and the grey triangles indicate male patients.

Scatter plot showing a relationship between BMI and preoperative OKS. Black squares indicate female patients and the grey triangles indicate male patients.