
Figure 3.
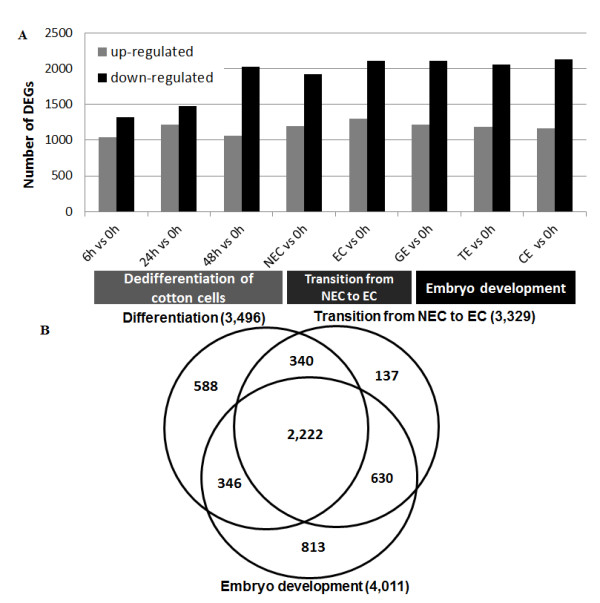
Histogram and Venn diagram of differentially expressed genes during SE. The number of genes up- or down-regulated at different time points/stages during SE (A) and a Venn diagram showing the differentially expressed genes in each of the three different developmental processes of cotton SE, with the overlapping regions corresponding to the number of differentially expressed genes present in more than one process. The central region corresponds to the expressed genes present in all three processes (B).