Figure 3.

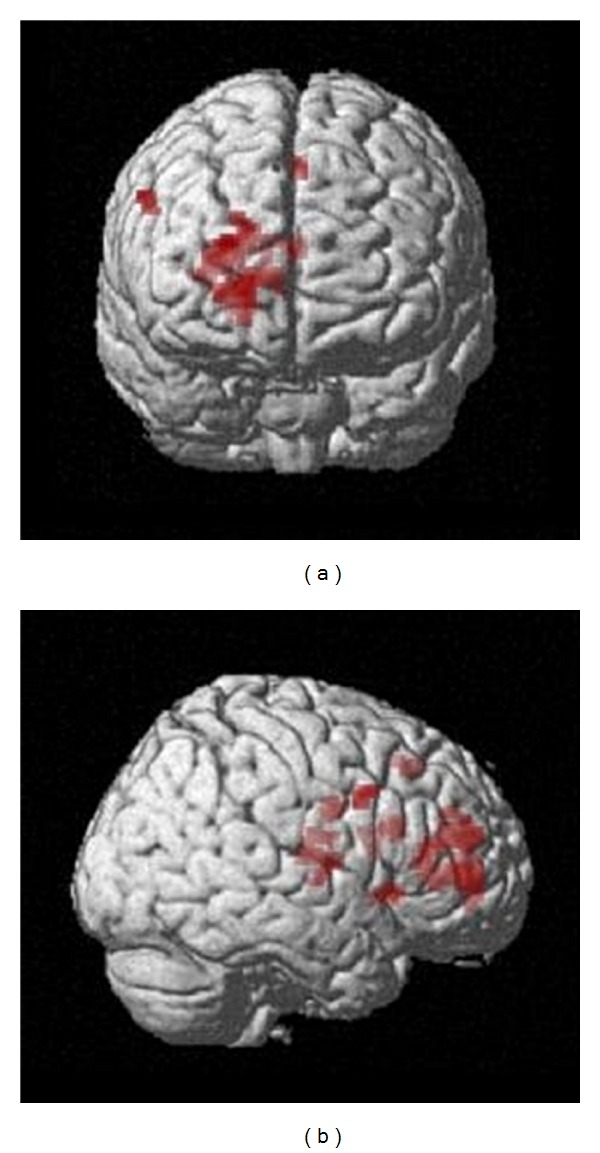
Anterior (top) and left lateral (bottom) views of the group activation map showing increased differential activity before the facilitation programme, for the contrast between past and control conditions (P = 0.01, k > 20).

Anterior (top) and left lateral (bottom) views of the group activation map showing increased differential activity before the facilitation programme, for the contrast between past and control conditions (P = 0.01, k > 20).