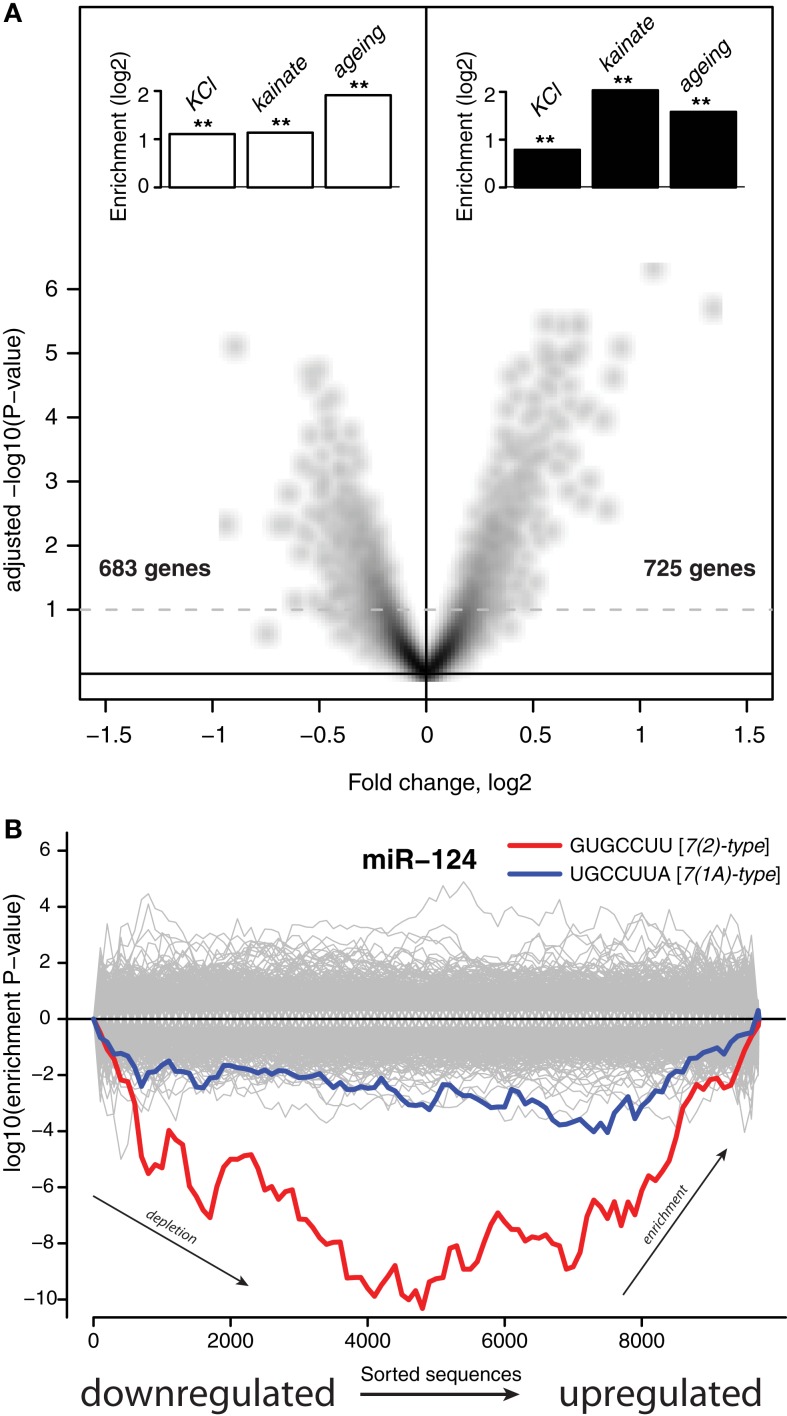
Figure 1.
Stress induces expression of genes subject to miRNA-mediated regulation. (A) The x-axis shows differential expression (log2) between mock transfected and untransfected cultures, the y-axis shows the adjusted P-value (−log10) for differential expression. Each point on the plot uniquely represents one gene, genes above the dashed line are differentially expressed with multiple testing adjusted P < 0.1. The insets show enrichment (log2) of genes either downregulated (white bars) or induced (black bars) by stressful treatments. Genes differentially expressed upon KCl treatment where identified by Illumina microarrays (Materials and Methods). Genes differentially expressed upon kainite treatment where derived from published microarray profiling data (Akahoshi et al., 2007; Materials and Methods). Mouse homologs (from HomoloGene; Sayers et al., 2010) of human genes that were previously reported as differentially expressed upon aging of the human brain comprised the aging sets. Double asterisks indicate hypergeometric P < 0.001 (Materials and Methods). The set of 10,849 genes detected by Illumina microarrays (Materials and Methods) in mock transfected and untransfected cultures was used as the universe for the hypergeometric tests. (B) The x-axis represents 3′UTRs corresponding to expressed genes sorted from most downregulated to most upregulated in comparison of mock transfected vs. untransfected cultures. P-values are calculated using the Sylamer method (van Dongen et al., 2008). Positive values on the y-axes represent nucleotide word enrichment [+|log10(P-value)|] and negative values represent depletion [−|log10(P-value)|]. The red and blue lines show enrichment profiles of 7(2) or 7(1A)-type seed matching sites (Bartel, 2009) for miR-124, the gray lines – for other miRNAs (Materials and Methods).

