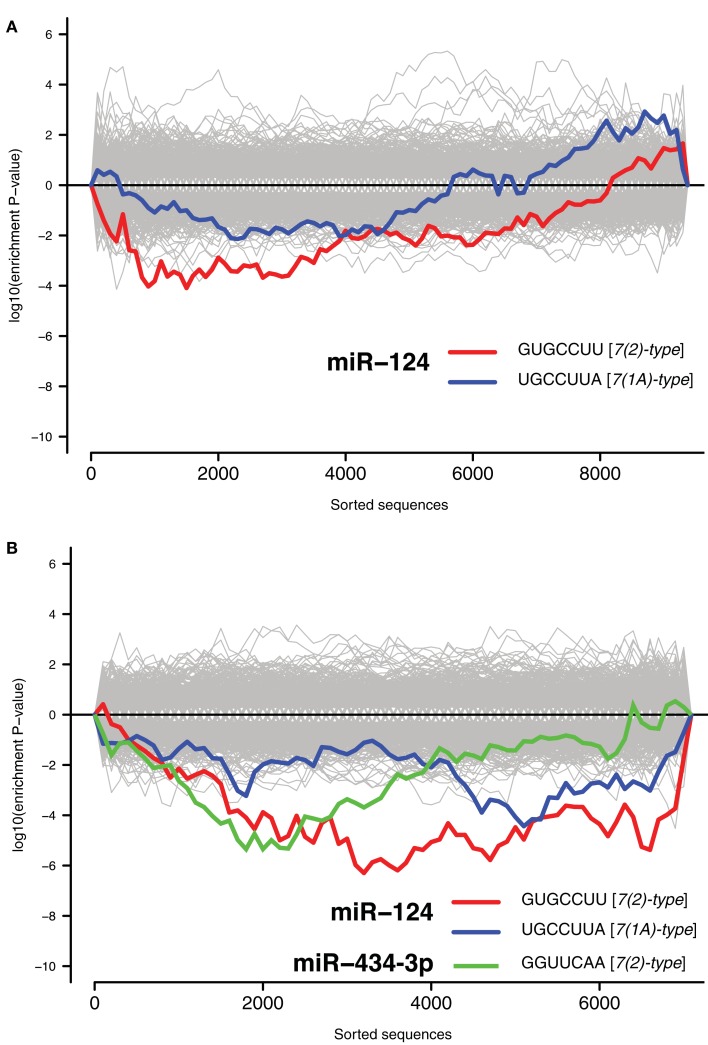
Figure 2.
Signal for activity of endogenous miR-124 and miR-434-3p. The x-axes represent 3′UTRs corresponding to expressed genes sorted from most downregulated to most upregulated in comparison of (A) cultures treated with KCl and untreated cultures and (B) mouse hippocampi treated with kainate and untreated hippocampi (Akahoshi et al., 2007). P-values are calculated using the Sylamer method (van Dongen et al., 2008). Positive values on the y-axes represent nucleotide word enrichment [+|log10(P-value)|] and negative values represent depletion [−|log10(P-value)|]. The red and blue lines show enrichment profiles of seed matching sites for miR-124 [7(2)-and 7(1A)-types; Bartel, 2009], the green line for miR-434-3p [7(2)-type], and the gray lines – seed matching sites for other miRNAs.

