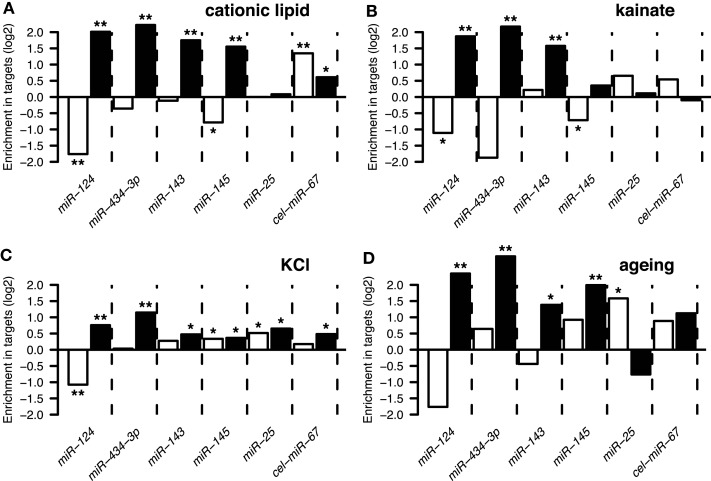
Figure 4.
The y-axis show enrichment of miRNA targets in genes that were downregulated (white bars) or induced (black bars) by four types of stressful treatments of neurons and the brain (Data Sheet 2 in Supplementary Material). These treatments are described in Results Sections “Induction of Stress Response Genes by the Transfection reagent” and “Other Treatments Also Induce the Response”: (A) treatment of primary neuronal cultures with cationic lipid transfection reagent; (B) treatment of the brain with kainate; (C) treatment of primary neuronal cultures with KCl; (D) ageing of the human brain. A single asterisk indicates hypergeometric P < 0.05, double indicates P < 0.001. The set of 10,849 genes detected by Illumina microarrays (see Materials and Methods) in mock transfected and untransfected cultures was used as the universe for the hypergeometric tests.

