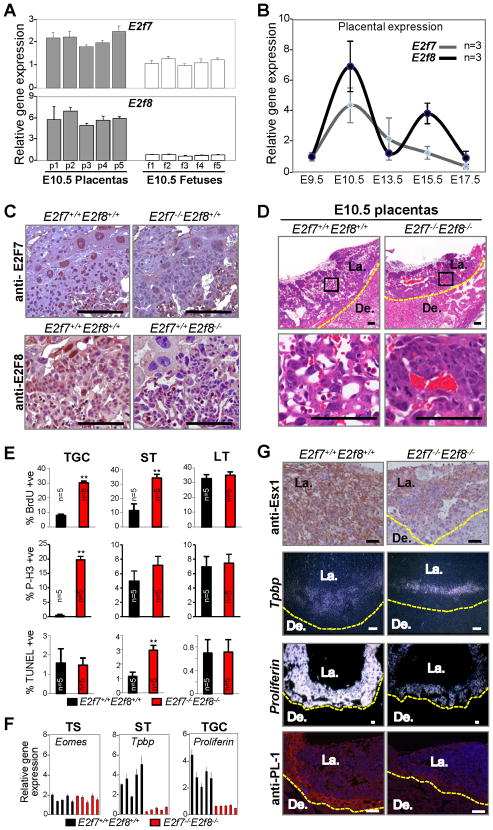
Figure 1. Profound Placental Defects in E2f7−/−E2f8−/− Embryos.
(A) Quantitative RT-PCR analysis of E2f7 and E2f8 expression in E10.5 wild type placentas (gray) and fetuses (white). (B) Quantitative RT-PCR analysis of E2f7 (grey) and E2f8 (black) expression in wild type placentas at different stages of embryonic development. (C) E2F7 (top) and E2F8 (bottom) protein expression as identified by immunohistochemistry (IHC) in E10.5 placental sections with the indicated genotypes. (D) Hematoxylin and Eosin (H&E) of E10.5 placental sections. Bottom panels are high magnification views of representative boxed areas in top panels. (E) Quantification of BrdU, TUNEL and P-H3 positive trophoblast cells in E10.5 E2f7+/+E2f8+/+ (black) and E2f7−/−E2f8−/− (red) placentas (** p<0.01). TGC, trophoblast giant cells; ST, spongiotrophoblasts; LT, labrynthine trophoblasts. (F) Quantitative RT-PCR analysis for trophoblast lineage markers in E10.5 E2f7+/+E2f8+/+ (black) and E2f7−/−E2f8−/− (red) placentas. (G) Qualitative analysis of differentiation markers in major trophoblast lineages in placentas. Top panel, representative IHC analysis of LT-specific Esx1 immunohistochemistry staining (E10.5); middle two panels, RNA in situ hybridization analysis of ST-specific Tpbp (E10.5) and TGC-specific Proliferin (E9.5); and lower panel, immunofluorescent detection of TGC-specific Placental Lactogen 1 (E10.5). Scale bars, 100 μm. Yellow dotted line demarks junctional zone from decidua. De., Decidua; La., Labyrinth.

