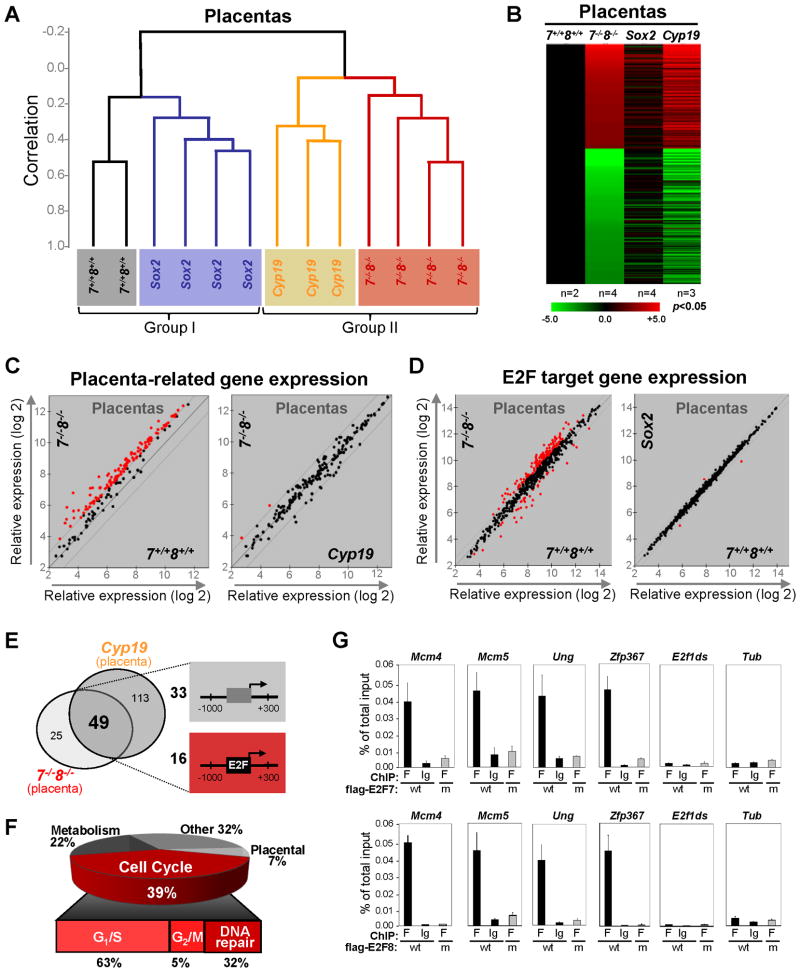
Figure 5. Sox2-cre Fetuses and Cyp19-cre Placentas Recapitulate Molecular Events in their Germline-deleted Counterparts.
(A) Dendogram of unsupervised hierarchical clustering analysis of gene expression from E10.5 placentas with the indicated genotypes. Note the segregation of placentas based on the genotypes. Sox2, Sox2-cre;E2f7loxp/−;E2f8loxp/−; Cyp19, Cyp19-cre;E2f7loxp/loxp;E2f8loxp/loxp; 7−/−;8−/−, E2f7−/−;E2f8−/−; 7+/+;8+/+, E2f7+/+;E2f8+/+. (B) Heat maps of genes with >2-fold misregulation in Cyp19, Sox2 or E2f7−/−;E2f8−/− placentas relative to E2f7+/+;E2f8+/+ placentas (p<0.05). n, number of placentas analyzed per genetic group. (C) Scatter plot analyses of placenta-related gene expression and E2F target gene expression in placentas with indicated genotypes using a 2-fold cutoff (red, >2-fold deregulation). (D) Scatter plot analyses of E2F target gene expression in placentas with indicated genotypes using a 1.5-fold cutoff (red, >1.5-fold deregulation). (E) Venn diagram depicting the overlap in genes significantly upregulated (>2-fold, p<0.05) in E2f7−/−E2f8−/− and Cyp19 placentas (left panel). Schematic diagram of two types of representative promoters are depicted on the right (−1000bp to +300bp relative to transcriptional start site) of the 49 genes shared between two placental sets. 16 of 49 promoters have at least one E2F binding site conserved between mice and humans. (F) Gene ontology of the 49 overlapping genes in E. (G) Chromatin immunoprecipitation (ChIP) assays confirming promoter occupancy by E2F7 and E2F8 in a subset of the 16 potential E2F targets from E. HEK293 cells overexpressing either flag-tagged versions of wild type E2F7 and E2F8 (wt), or DNA binding mutant E2F7 and E2F8 (m) were used. Quantitative RT-PCR (normalized to 1% of input) was performed using primers specific to the E2F binding sites in target gene promoters as well as to irrelevant sequences in the tubulin promoter (Tub) and in the E2f1 downstream coding region (E2f1ds).

