
Figure 2.
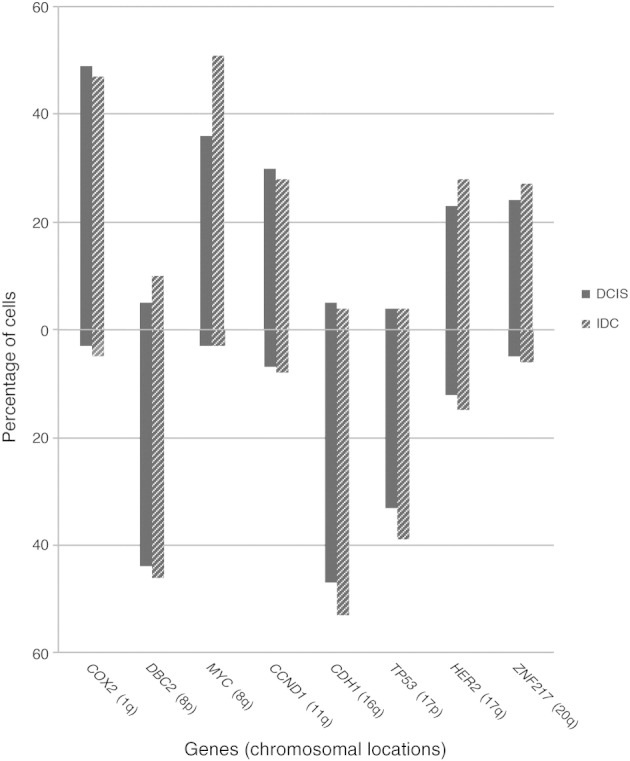
Average gain and loss frequencies for all the gene markers in cells of DCIS and IDC. Percentages of cells with gains are shown above the 0% line and with losses below the 0% line.
Official websites use .gov
A
.gov website belongs to an official
government organization in the United States.
Secure .gov websites use HTTPS
A lock (
) or https:// means you've safely
connected to the .gov website. Share sensitive
information only on official, secure websites.
Average gain and loss frequencies for all the gene markers in cells of DCIS and IDC. Percentages of cells with gains are shown above the 0% line and with losses below the 0% line.