
Figure 5.
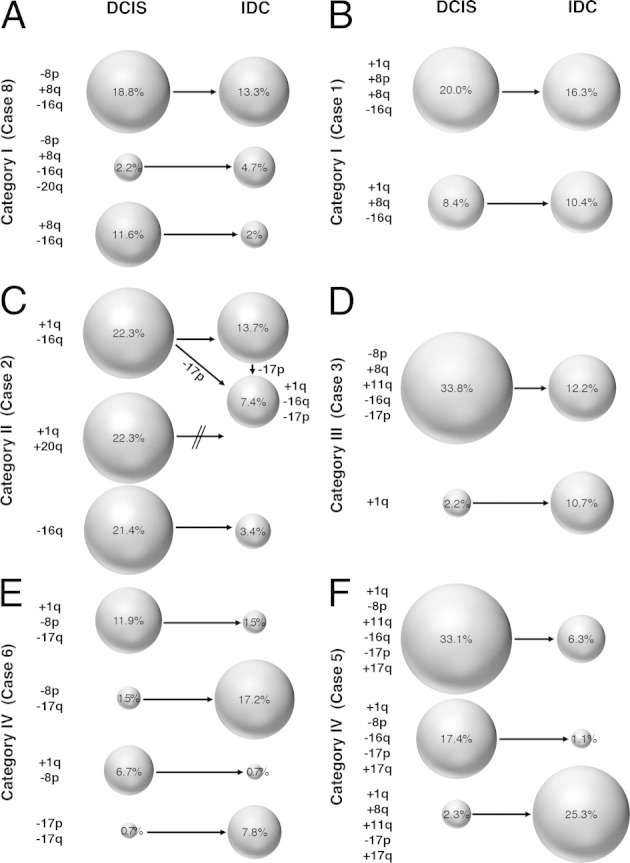
Schematic presentation of examples of clonal evolution in categories I (A and B), II (C), III (D), and IV (E and F) based on the presence of imbalance clones. These graphs were derived from the results summarized in Figure 4 and in Supplemental Figure S1 (available at http://ajp.amjpathol.org). For example, in case 8 (A), the major clone in DCIS [an 18.8% gain of MYC (+8q), losses of DBC2 (−8p) and CDH1 (−16q)] was also the major clone in IDC (13.3%). A rare clone in the DCIS (a gain of MYC, losses of DBC2, CDH1, and ZNF217) expanded to become the second largest clone, whereas the second largest clone in DCIS (a gain of MYC, a loss of CDH1) became rare in the IDC. The text on the left of each panel denotes whether specific chromosome arms are gained (+) or lost (−). The sizes of the circles reflect the frequency with which a clone occurred, which is specified by the percentages in the circles as well. In C, the clone that occurred in 7.4% in the IDC could have emerged by losses of 17p from either the major clone in the DCIS (+1q, −16q) or the IDC clone present in 13.7% of the cells. Note that one of the major clones in the DCIS (+1q, +20q) vanished in the IDC.