
Figure 1.
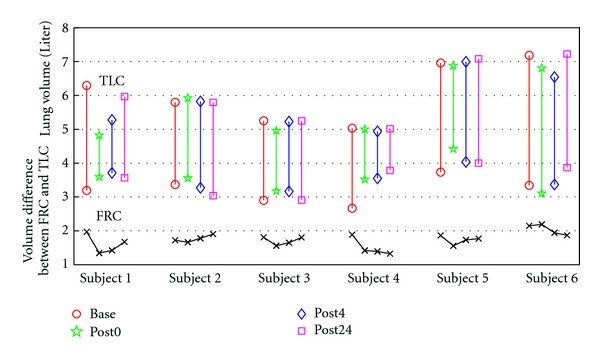
Lung volumes at FRC and TLC pressures, and the volume difference between FRC and TLC scans in each phase for six subjects.
Official websites use .gov
A
.gov website belongs to an official
government organization in the United States.
Secure .gov websites use HTTPS
A lock (
) or https:// means you've safely
connected to the .gov website. Share sensitive
information only on official, secure websites.
Lung volumes at FRC and TLC pressures, and the volume difference between FRC and TLC scans in each phase for six subjects.