
Figure 12.
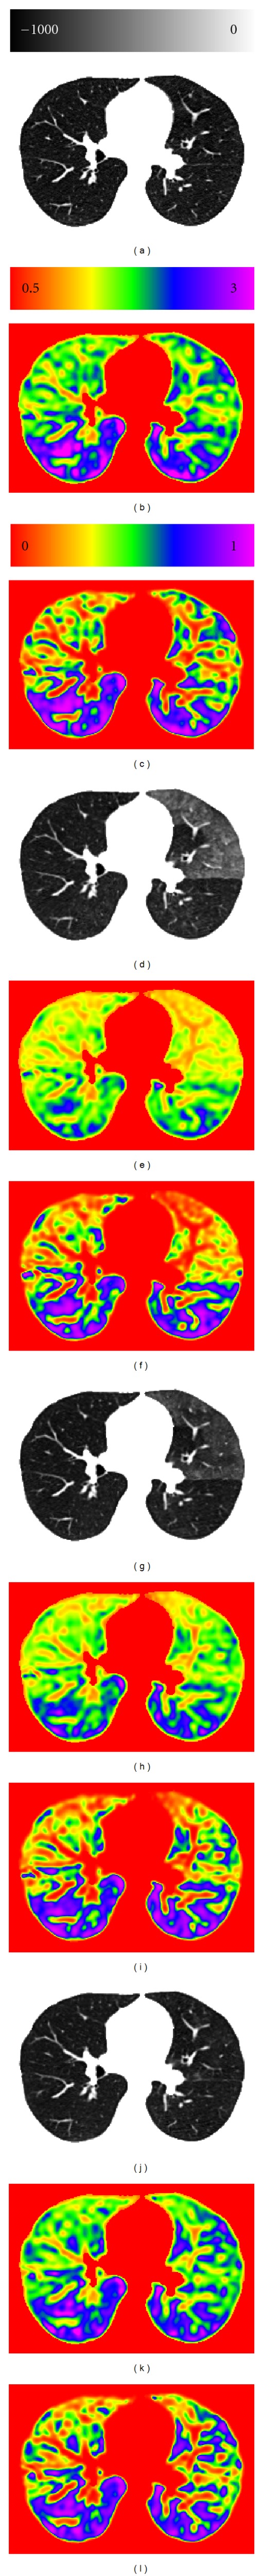
Comparison of local lung function estimates over different phases. (a), (d), (g), and (j) show the intensity pattern on the same slice from baseTLC, deformed post0TLC to baseTLC, deformed post4TLC to baseTLC, and deformed post24TLC to baseTLC, respectively. (b), (e), (h), and (k) show the Jacobian maps estimated from four phases on the slice. (c), (f), (i), and (l) show the corresponding rank maps of Jacobian estimates.