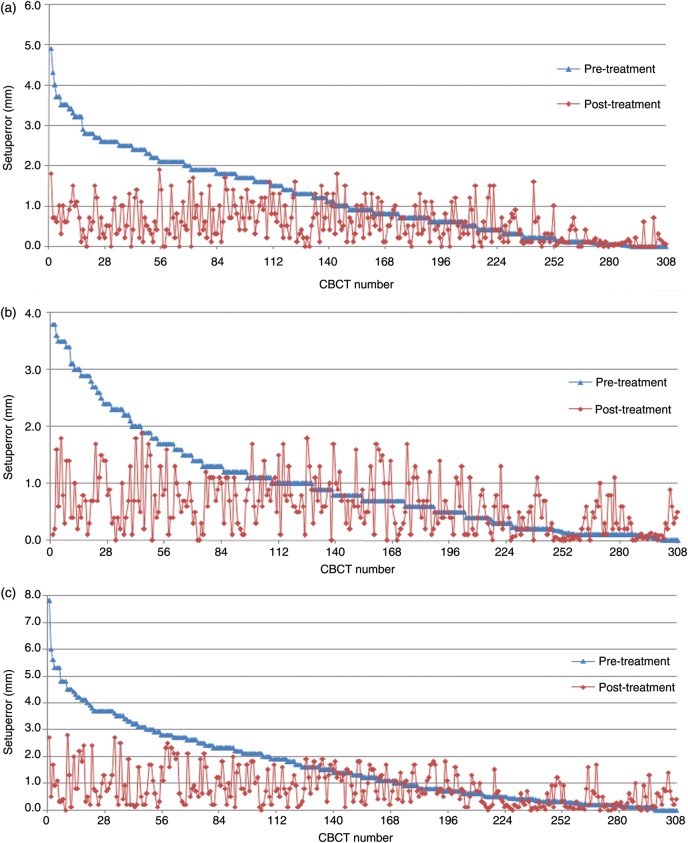
Figure 1.
Distribution of 308 paired interfractional and intrafractional errors in the RL (a), SI (b) and AP (c) directions measured separately by pretreatment and post-treatment CBCT scans
The blue dots denote the interfractional errors in descending order, and the red dots denote the corresponding intrafractional errors. RL = right–left direction; SI = superior–inferior direction; AP = anterior–posterior direction.

