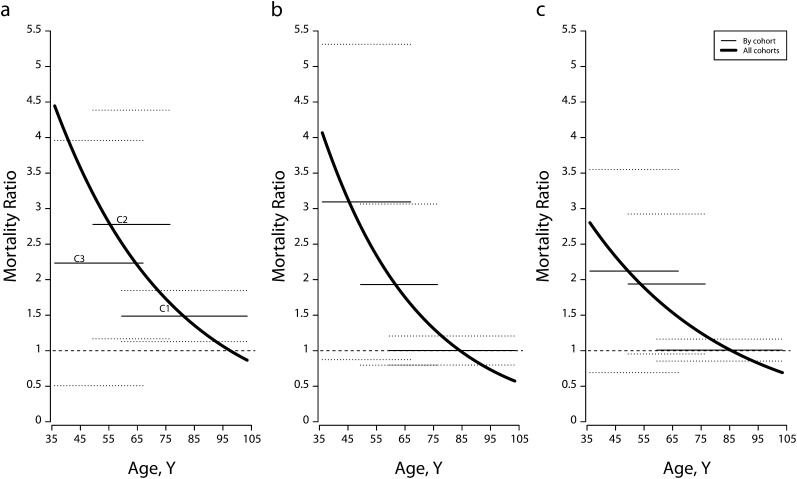
FIGURE 2—
Age-specific mortality ratios, estimates, and 95% confidence intervals for women with (a) severe obesity, (b) moderate obesity, and (c) overweight, by birth cohort, versus all cohorts combined: National Health and Nutrition Examination Survey, 1988–1994.
Note. BMI = body mass index. Dotted lines represent 95% confidence intervals. Birth cohort C1 = 1901–1930, C2 = 1931–1940, and C3 = 1941–1957. Estimates were based on Gompertz models. Covariates were educational achievement, race/ethnicity, poverty—income ratio, marital status, smoking, weight loss, and lung diseases. The analysis excluded underweight participants (BMI < 18.5 kg/m2) and participants younger than 36 years at baseline. Sample weights were used. The reference category was normal weight (BMI = 18.5 – < 25 kg/m2).
Source. Data were drawn from the 1988–1994 National Health and Nutrition Examination Survey, with mortality through December 2006.19

