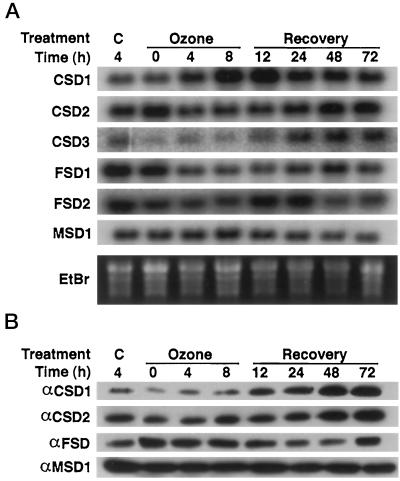
Figure 10.
Regulation of SOD isoenzyme expression in response to ozone fumigation. Plants were fumigated with 330 ppb ozone for 8 h. C represents unfumigated control plants maintained in charcoal-filtered air. The ozone-treated plants were returned to charcoal-filtered air during the recovery period. A, RNA-blot hybridization using the cDNAs listed on the left as probes. B, Immunoblots of protein extracted from plants grown in the same pots as used for the RNA blots in A. The proteins were immunodetected using the antisera listed on the left.

