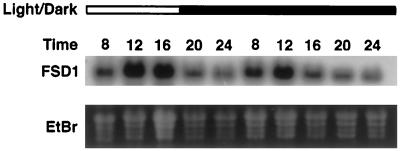
Figure 7.
Circadian oscillation of FSD1 mRNA. Total RNA was isolated from tissue collected between 8 am and midnight from plants grown for 21 d in a 9-h photoperiod (lights were on from 8 am to 5 pm) and subjected to RNA blot hybridization analysis conducted using an FSD1 cDNA probe. The open bar at the top of the figure represents samples harvested during the illuminated period; the dark bar represents darkness. The time is presented on a 24-h time scale.

