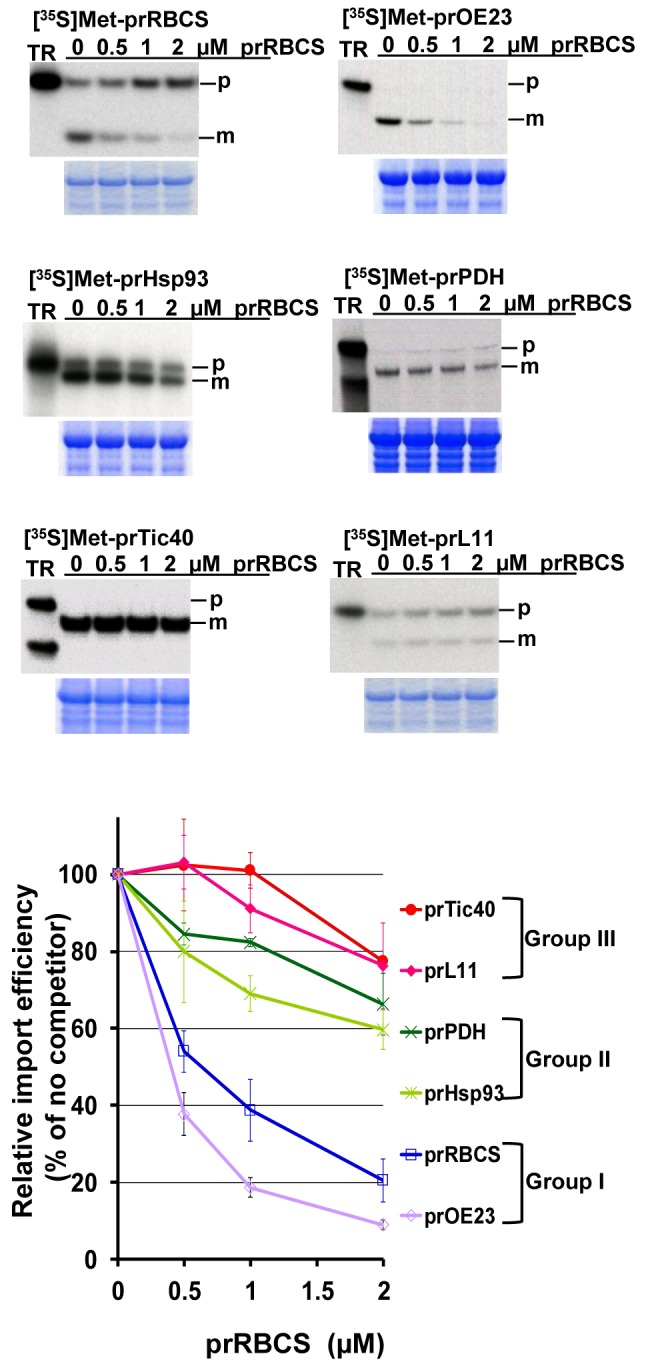
Figure 3. Import competition of a group I precursor with representative precursors of the three groups.

Various [35S]Met-labeled precursors were imported with 0 to 2 µM recombinant prRBCS, as labeled on top of the gel, into chloroplasts isolated from 8-d-old pea seedlings for 15 min. Intact chloroplasts were re-isolated and analyzed by SDS-PAGE, stained with Coomassie Blue, and dried for autoradiography. An equal amount of protein was loaded in each lane of the same gel. The region around the endogenous RBCL is shown below the autoradiograph to confirm that loading was equal in each lane. Imported mature protein was quantified using a phosphorimager and normalized to the amount of endogenous RBCL obtained by scanning the Coomassie Blue–stained gels. The line graph shows quantifications of relative import efficiencies, with the amount of mature protein imported in the absence of recombinant prRBCS set as 100%. Precursor groups are labeled on the right. Data shown are means ± SD, n = 3. m, mature form; p, precursor form; TR, in vitro–translated precursor proteins before import.
