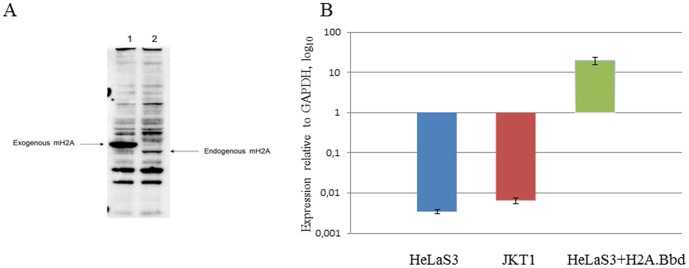
Figure 1. Expression levels of ectipically expressed macroH2A1.1 and H2ABbd.
a, HeLa S3 cells overexpressing tagged macroH2A1.1 (1) as compared to endogenous macroH2A (2) in the control HeLa S3. Western Blot with staining with the anti- macroH2A antibodies (Active Motif); b, The expression of H2A.Bbd was measured using qRT-PCR in JKT1 human testicular seminoma cells, HeLa S3 and HeLaS3 ectopically expressing H2A.Bbd. Mean values are shown, error bars represent S.E.M. of 2 independent experiments.

