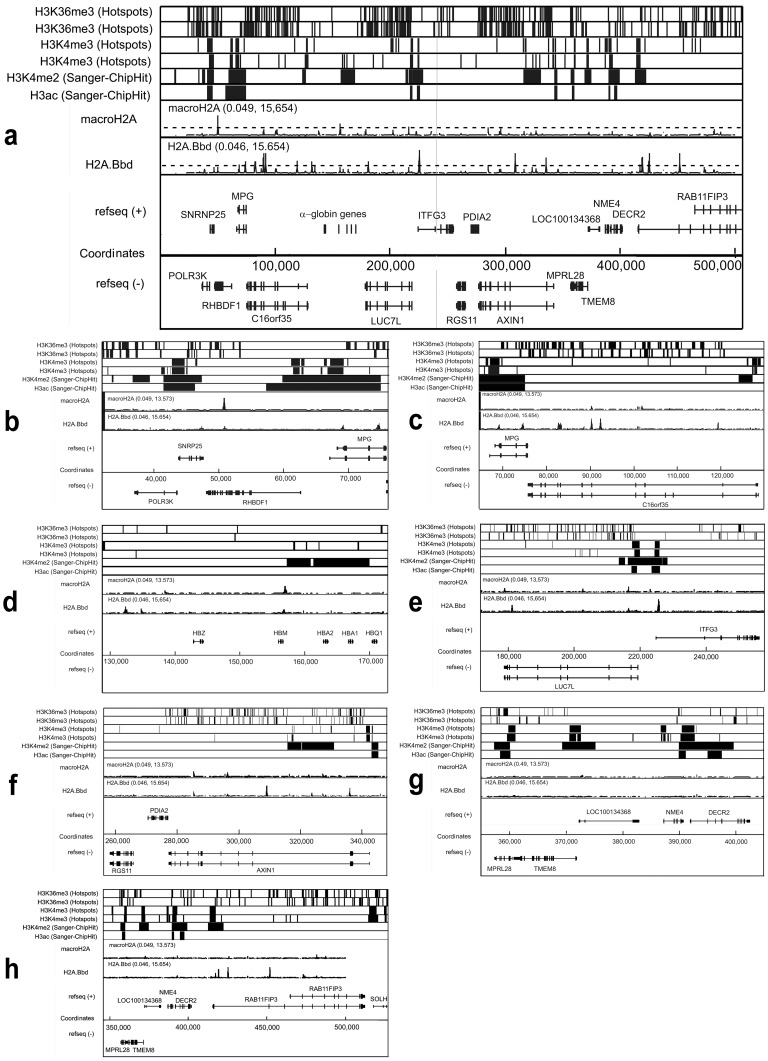
Figure 3. Distribution of sites of preferential location of macroH2A1.1 and H2A.Bbd within the telomeric end of the short arm of human chromosome 16.
(a) Low magnification picture showing the whole area under study. (b–f) High magnification (zoomed in) pictures showing consecutive sections of the area under study. Distribution of histone H3 tri-methylated at lysine 36 (H3K36me3), histone H3 tri-methylated at lysine 4 (H3K4me3), histone H3 di-methylated at lysine 4 (H3K4me2) and panacetylated histone H3 (H3ac) is presented according to the Pilot Encode datasets. Positions of genes are shown according to the UCSC genome browser (assembly HG18). For H3K36me3 and H3K4me3 two independent sets of data are shown. The values in brackets above the graphs showing distribution of macroH2A1.1 and H2A.Bbd represent the range of the transformed signal, (range of −log10(p-values) of the ACME p-values). The black broken lines in the sections showing distribution of macroH2A1.1 and H2A.Bbd indicate the significance level (−log10(p-value = 4)).

