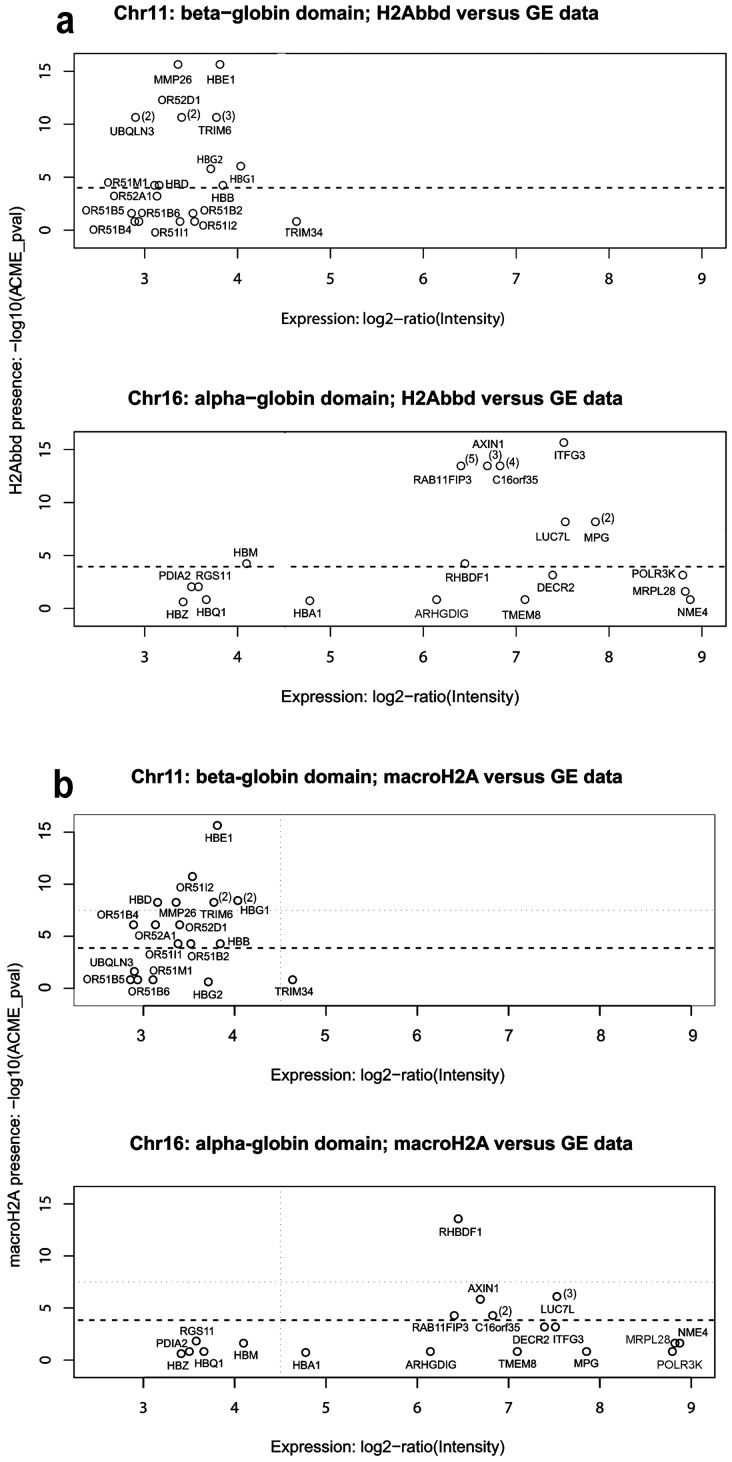
Figure 5. Distribution of H2A.Bbd and macroH2A1.1 on chromosomes 11 and 16.
H2A.Bbd (max(−log10(ACME-p-values)) (a) and macroH2A1.1 (max (−log10(ACME-p-values)) (b) in the gene body and short upstream area [−400; TSS] versus gene expression levels is shown for genes present in the selected areas of chromosomes 11 and 16. Figures to the right of gene positions show the number of significant peaks of macro H2A (a) and H2A.Bbd (b) present within the gene body (when this number was more than 1). See the text for details.

