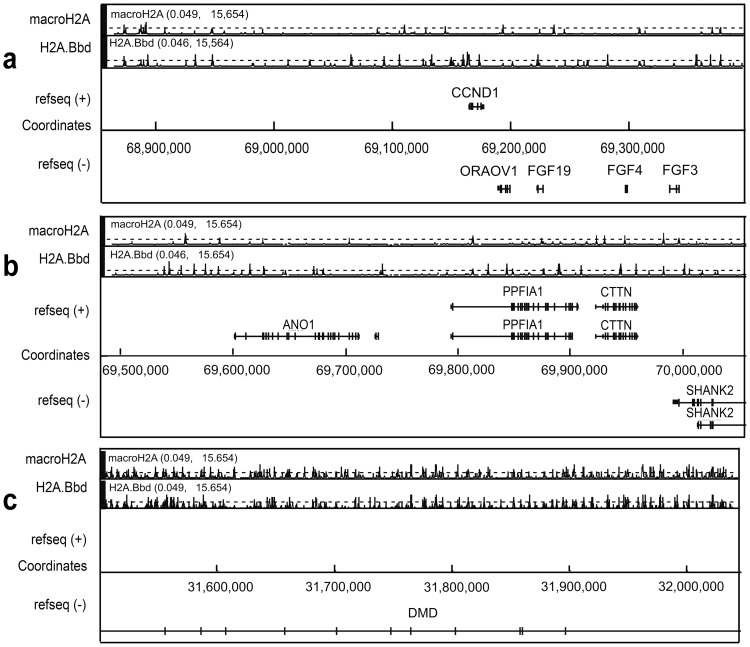
Figure 6. Distribution of sites of preferential location of macroH2A1.1 and H2A.Bbd within the telomeric end of the chromosome 11 (a) and the region of the X chromosome containing the DMD gene (b).
The values in brackets above the graphs showing distribution of macroH2A1.1 and H2A.Bbd represent the range of the transformed signal, (range of −log10(p-values) of the ACME p-values). The black broken lines in the sections showing distribution of macroH2A1.1 and H2A.Bbd indicate the significance level (−log10(p-value = 4)).

