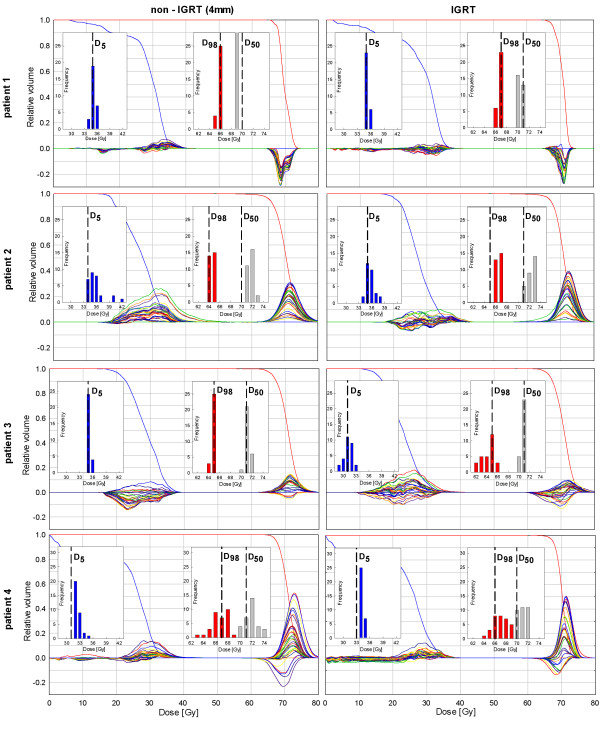
Figure 2.
Planning DVHs of the spinal cord (blue) and CTV (red) and respective fraction DVHs (plotted as illustrated in Figure1b) for the non-IGRT and the IGRT approach. Additionally shown are the D5 (blue), D98 (red), and D50 (grey) histograms to demonstrate the variation over all fractions. The respective planned values are plotted in black dashed lines.

