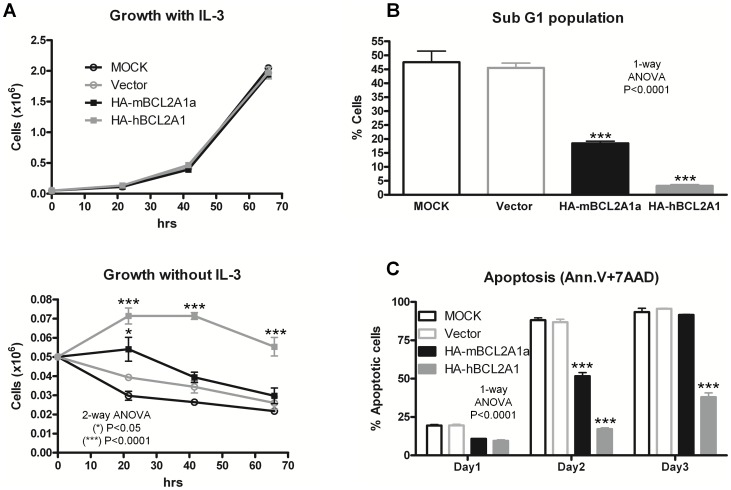
Figure 2. Impact of BCL2A1 over-expression in BAF3 cells.
(A) Growth curves for BAF3 cells grown with or without murine IL-3. Viable cell numbers are shown over time. (B) Cell cycle analysis on BAF3 cells grown without IL-3. (C) Apoptosis assessed via Annexin V-PE staining in the absence of IL-3. All experiments were repeated 3 times and carried out in triplicates. Figure shows results obtained for one representative experiment. Data averages plus or minus standard deviations were plotted. HA-mBCL2A1a and HA-hBCL2A1 are respectively murine and human HA-BCL2A1.

