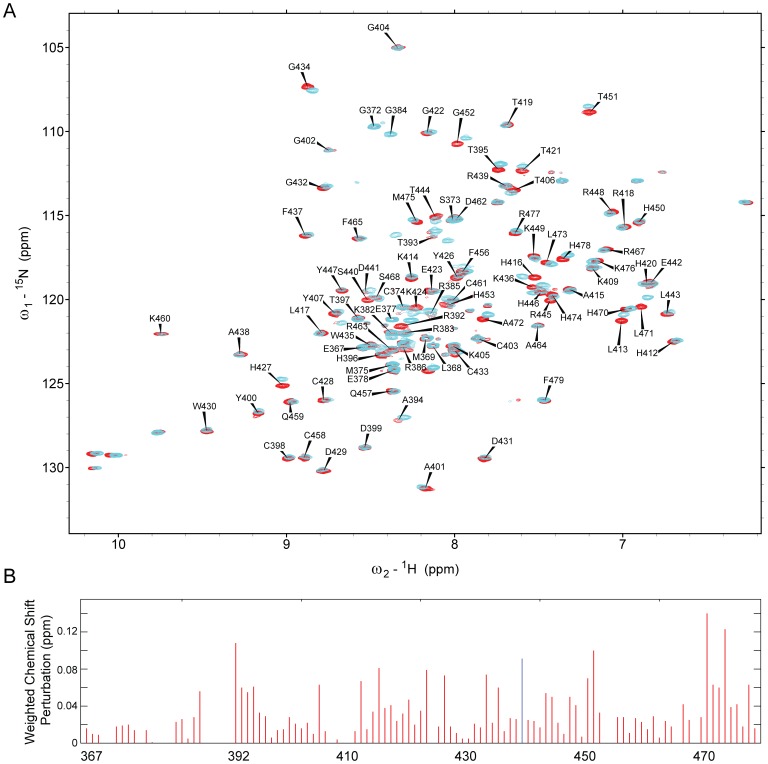
Figure 3. Identification of the binding interface in KLF4 367–479.
A: 2D 1H,15N-HSQC spectrum for KLF4 (367–479) (red), labelled with resonance assignments, overlaid with a spectrum observed in the presence of 300 µM p53 (1–57) pT55 as a ligand (cyan). B: Chemical shift perturbations of KLF4 (367–479) residues upon addition of p53 (1–57) pT55. No signal was observed for Ser440 (blue) in the presence of p53.

